Have you ever wondered how your daily life as a consumer might be affected by events occurring around the world?
With everything going on right now between Russia and Ukraine, how is the world economy reacting?
Today, we’re going to talk about how war and other geopolitical events affect the markets.
War and the Stock Market
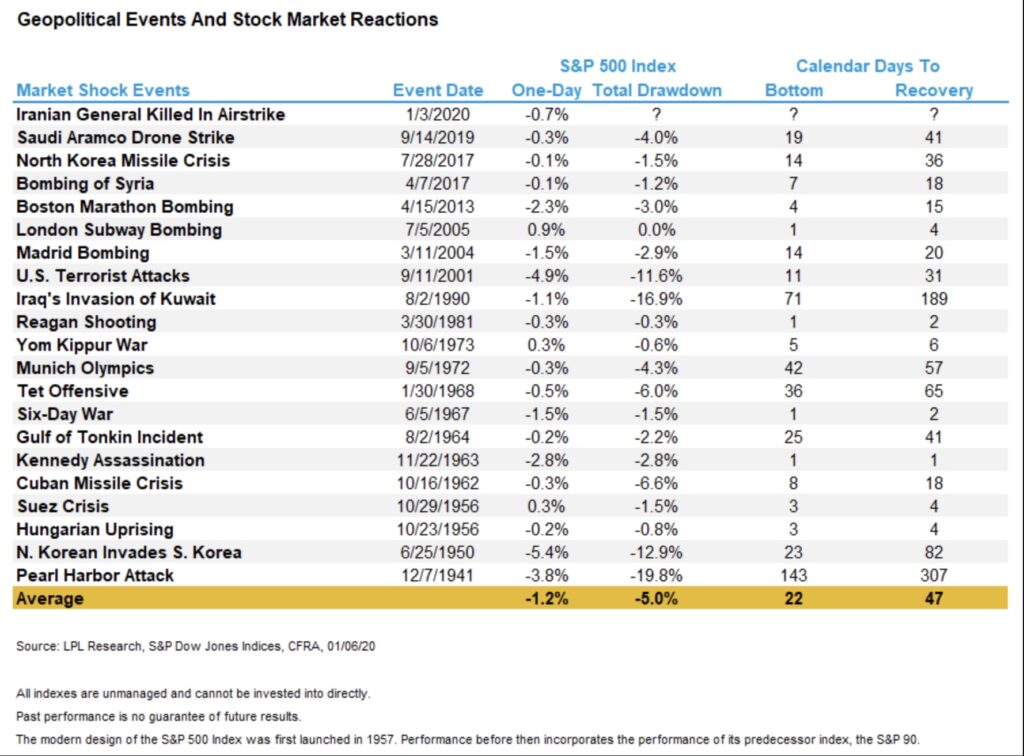
Here we have a table showing some of the biggest geopolitical events of the last century along with how they affected the stock market.
As you can see, the market reactions don’t tend to be too harsh.
The average reaction was a 5% drop, with the most dramatic reaction having been about a 20% drop.
The average amount of time for the market to recover from one of these events was 47 days, with the longest recovery time being 307 days.
The event that had the worst effect on the stock market by both of the above measures is the attack on Pearl Harbor in the early 1940s.
The reaction and recovery numbers for the Pearl Harbor attack are far more severe than the numbers for most of the other events, making it a possible outlier that’s making the data seem worse than it is.
The most recent significant geopolitical event on the table, the Saudi Aramco Drone Strike, seemed to hardly affect the market at all.
With less than a 1% initial drop, a 4% overall drop, and a 41-day recovery time, this event wouldn’t have been worth panic selling over.
So what do these numbers mean for the average investor? Is it time to sell, or do we need to stop ourselves from overreacting?
First of all, keep in mind that these events did not have any lasting effects on the stock market.
Any drop attributable to one of these events was recovered from in less than a year (less than three months in most cases).
So it doesn’t really make sense to sell off your stocks for one of these events if you’re a long-term investor.
In fact, if you’re a true fundamental investor, a political event shouldn’t drive you to sell your investments unless you truly believe that it changes the intrinsic value of those investments.
So the moral of the story is that, based on historical data, there’s no need to panic.
War and the Commodities Markets
The effects of war on commodities are a little more significant than with stocks.
When we talk about the prices of commodities, we’re usually referencing the price of futures contracts for certain commodities.
A futures contract is an agreement between two parties to exchange an item at a previously agreed upon price.
If futures are going up, that means that investors are expecting the price of the underlying commodity to increase in the near future.
Investors could have this sentiment for many reasons, including an expected supply constraint.
This seems to be the case for oil right now; with the threat of a ban on Russian oil, investors are likely predicting that this decrease in the supply will lead to higher oil prices.
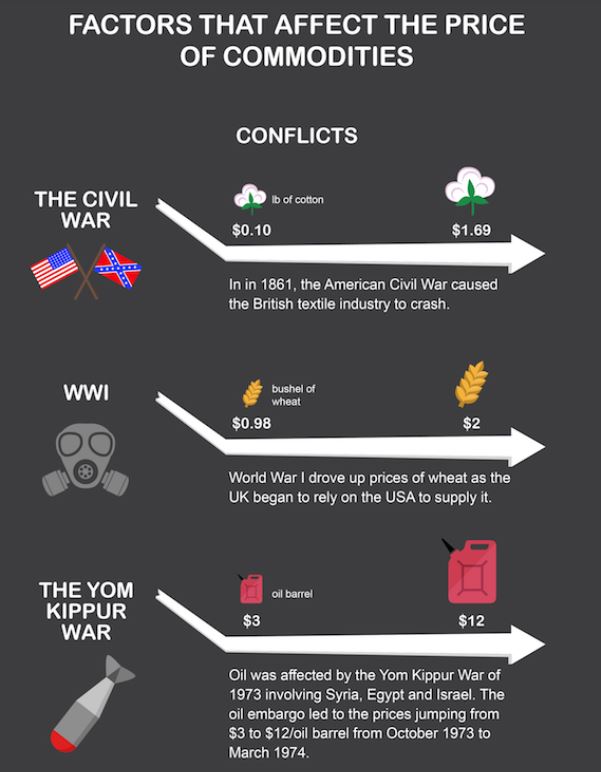
Let’s take a look at this graphic describing the effects of war on commodity prices in the UK.
World War I caused the price of wheat to double as a result of a constriction of the supply in the UK.
The oil embargo in the 1970s led to the quadrupling of the price of oil in the UK.
The concerns around oil right now could be a preview to something more serious happening in the near future.
If you want to learn more about the current state of oil and how it’s affecting gas prices, check out our article called Why Are Gas Prices Increasing?
Final Thoughts
While not everyone is a professional futures trader who pays close attention to commodities prices, we all still see the effects of war and other geopolitical situations.
Ranking of Top Stock Newsletters Based on Last 3 Years of Stock Picks as of December 27, 2025
We are paid subscribers to dozens of stock and option newsletters. We actively track every recommendation from all of these services, calculate performance, and share our results of the top performing stock newsletters whose subscriptions fees are under $500. The main metric to look for is "Return vs S&P500" which is their return above that of the S&P500. So, based on December 27, 2025 prices:
Best Stock Newsletters Last 3 Years' Performance
| Rank | Stock Newsletter | Picks Return | Return vs S&P500 | Picks w Profit | Max % Return | Current Promotion |
|---|---|---|---|---|---|---|
| 1. | Alpha Picks | 82% | 56% | 76% | 1,583% | March, 2026 SALE: SAVE $50 NOW |
| Summary: 2 picks per month based on Seeking Alpha's Quant Rating; consistently beating the market every year since launch; tells you when to sell and they have sold almost half. See complete details in our full Alpha Picks review. Or get their Premium service to get their QUANT RATINGS on your stocks to better manage your current portfolio--read our Is Seeking Alpha Worth It? article to learn more about their Quant Ratings. | ||||||
| 2. |  Zacks Value Investor | 60% | 40% | 54% | 692% | March, 2026 Promotion: $1, then $495/yr |
| Summary: 10 stock picks per year on January 1st based on Zacks' Quant Rating; Retail Price is $495/yr and includes 6 different services including those below. Read our Zacks Review. | ||||||
| 3. |  Moby.co | 50% | 16% | 74% | 2,569% | March, 2026 Promotion: Next pick free! |
| Summary: 60-150 stock picks per year, segmented by industry; consistently beating the market every year; retail price is $199/yr. Read our full Moby Review. | ||||||
| 4. | Zacks Top 10 | 36% | 15% | 71% | 170% | March, 2026 Promotion: $1, then $495/yr |
| Summary: 10 stock picks per year on January 1st based on Zacks' Quant Rating; Retail Price is $495/yr and includes 6 different services. Read our Zacks Review. | ||||||
| 5. |  TipRanks SmartInvestor | 20% | 9% | 62% | 464% | Current Promotion: Save $180 |
| Summary: About 1 pick/week focusing on short term trades; Lifetime average return of 355% vs S&P500's 149% since 2015. Retail Price is $379/yr. Read our TipRanks Review. | ||||||
| 6. |  Action Alerts Plus | 27% | 5% | 66% | 208% | Current Promotion: None |
| Summary: 100-150 trades per year, lots of buying and selling and short-term trades. Read our Jim Cramer Review. | ||||||
| 7. | Zacks Home Run Investor | 5% | -0.4% | 45% | 241% | March, 2026 Promotion: $1, then $495/yr |
| Summary: 40-50 stock picks per year based on Zacks' Quant Rating; Retail Price is $495/yr. Read our Zacks Review. | ||||||
| 8. | Dogs of the Dow Strategy | 16% | -1.8% | 43% | 44% | Current Promotion: None |
| Summary: Buy the 10 highest yielding dividends stocks in the Dow Jones Industrial Average on January 1st and sell on Dec 31st each year. | ||||||
| 9. | IBD Leaderboard ETF | 11.4% | -1.8% | n/a | n/a | March, 2026 Promotion: NONE |
| Summary: Maintains top 50 stocks to invest in based on IBD algorithm; Retail Price is $495/yr. Read our Investors Business Daily Review. | ||||||
| 10. | Stock Advisor | 34% | -3.9% | 75% | 289% | March, 2026 Promotion: Get $100 Off |
| Summary: 2 picks/month and 2 Best Buy Stocks lists focusing on high growth potential stocks over 5 years; Retail Price is $199/yr. Read our Motley Fool Review. | ||||||
| 11. | Zacks Under $10 | -0.2% | -4% | -4.3 | 263% | March, 2026 Promotion: $1, then $495/yr |
| Summary: 40-50 stock picks per year based on Zacks' Quant Rating; Retail Price is $495/yr. Read our Zacks Review. | ||||||
| 12. | Rule Breakers | 34% | -5.1% | 69% | 320% | Current Promotion: Save $200 |
| Summary: Rule Breakers is included with the Fool's Epic Service. Get 5 picks/month focusing on disruptive technology and business models; Lifetime average return of 355% vs S&P500's 149% since 2005; Now part of Motley Fool Epic. Read our Motley Fool Epic Review. | ||||||
| Top Ranking Stock Newsletters based on their last 3 years of stock picks covering 2025, 2024, and 2023 performance as compared to S&P500. S&P500's return is based on average return of S&P500 from date each stock pick is released. NOTE: To get these results you must buy equal dollar amounts of each pick on the date the stock pick is released. Investor Business Daily Top 50 based on performance of FFTY ETF. Performance as of December 27, 2025. | ||||||