Motley Fool vs. IBD Leaderboard: Which one is better?
Summary;
- IBD Leaderboard by Investors Business Daily is priced at $69 per month and caters to technical traders, providing annotated charts, coaching, and utilizing the CANSLIM strategy
- Most investors may find Motley Fool’s Stock Advisor more accessible, especially those new to investing looking for specific stock picks or seeking a straightforward long-term investment strategy.
Technology and the internet have enabled retail investors to utilize digital resources to improve investment performance and get educated on the stock market.
However, there is also plenty of room for misinformation on the internet.
Accordingly, it’s very important to find reputable and accurate information sources, especially when it comes to managing your money.
Two very popular investment services are:
- Stock Advisor by The Motley Fool
- IBD Leaderboard by Investors Business Daily
This article will show you my experience with the 2 services over the last 8 years and I will share what you need to know about the pros and cons of each.
Motley Fool vs. IBD Leaderboard at a glance
| Motley Fool | IBD Leaderboard | |
| Overall rating | ⭐⭐⭐⭐⭐ | ⭐⭐⭐ |
| Service type | Stock research & stock picking services | Fundamentals and Technical Analysis |
| Best for | All investors | Technical Traders |
| Key Features | Two stock picks per month, a starter stock list for diversification, and recommendations from Motley Fool analysts. Stock Advisor service is outperforming the market by 750% to SP’s 160% over the last 20 years. | Access to stock, options, and ETF charts, coaching, and the CANSLIM strategy, incorporating factors like earnings, new products, supply, and demand. |
| Trial Offer | 30-day money-back guarantee | Offers a 30-day trial, allowing users to explore the service before committing to a subscription. |
| Retail Cost | $199/year | $69/month |
| Special offer | First year for $99 on THIS promo page | No special offer (Motley Fool Stock Advisor – Preferred Choice) |
Which one is better? Since I have been a subscriber to both for years, I have a very clear opinion on this.
Before we jump into discussing Stock Advisor and the IBD leaderboard…
…let’s discuss the different types of investing strategies and how each of these services can benefit different investors.
Why I Subscribe to the Motley Fool
How do you consistently find winning stock picks?
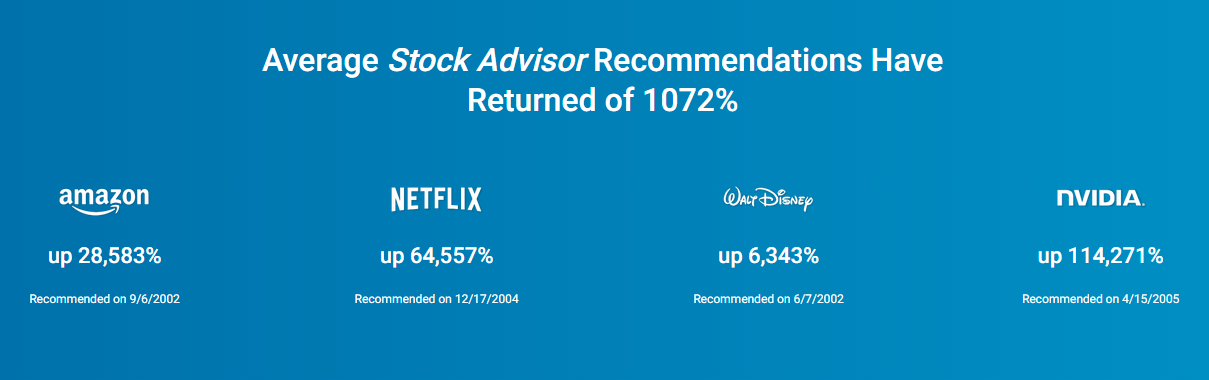
For me, that’s why I subscribe to the Motley Fool’s Stock Advisor service. Their analysts have been recommending stocks since 2002, and the results speak for themselves. While the S&P 500 is up about 178% in that time, Motley Fool Stock Advisor picks have soared 937% overall. That’s not luck—it’s a track record more than four times better than the market.
The best part? These aren’t the household names you see on CNBC every day...at least not yet. The Motley Fool has a history of recommending companies before Wall Street catches on—think Amazon, Tesla, and Netflix, long before they became giants. Those are stocks I would've found way too late if it weren't for the Fool.
And right now, you can save $100 on a Motley Fool Stock Advisor subscription and see their next stock pick.
Fundamental Vs. Technical Investing
Novice investors often think they need to be experts on every facet of the investing world.
However, this thinking can be very dangerous and counterproductive.
Education is very important in investing because the more you know, the more likely you are to spot inconsistencies or avoid a bad trade.
Regardless, you can take too much information from very different perspectives, leading to serious losses if you’re not careful.
For example, many long-term investors prefer fundamental analysis because the company’s performance and resources represented by the stock illuminate potential for profit or loss.
Short-term traders and mathematically minded investors sometimes prefer technical investing because it focuses on things like:
- Stock charts;
- Trading volume; and
- Moving averages.
These factors tend to ignore the fundamentals.
The fundamental investor will take a company like Apple or Starbucks and analyze everything from the top down.
Think of things like quarterly and annual earnings, industry benchmarks, executive leadership, and price/earnings (P/E) ratios.
These all factor in deciding whether you will buy stock or not.
A technical trader will look at the stock chart with the goal being to understand the short-term trends and what other traders are doing.
These traders will also evaluate if the stock will be breaking through support or resistance, which could potentially reverse the direction of the stock movement.
Since these are both very different approaches with very different objectives…
…it’s title to determine what style of investing you want to do as well as what style of investing you are getting your news from.`
The IBD Leaderboard
IBD leaderboard is a monthly subscription service primarily for technical traders.
For $69 a month, you get…
- Access to stock, options, and ETF charts;
- A free IOS app; and
- Coaching from IBD.
- Access to their top 50 rated stocks, ie, their Leaderboard
The Leaderboard looks like this:
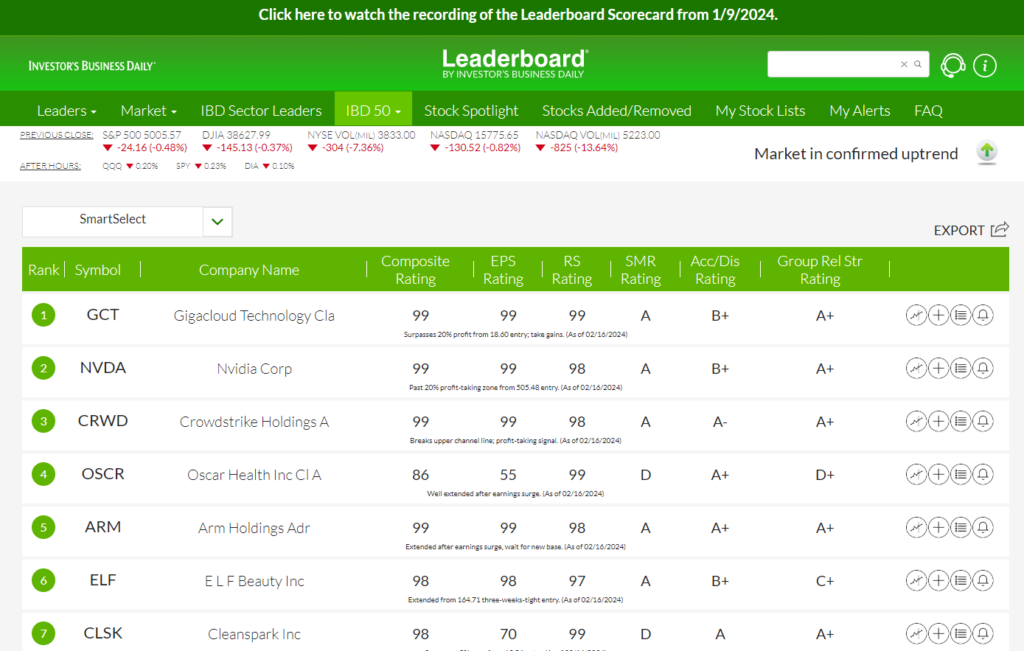
Note the various ratings and an overall composite score. On the right of each line you will see 4 quick access links. Technical traders will enjoy annotated charts provided by IBD.
These charts show show entry and exit points, and recommendations on “how to train” a particular stock.
Subscribers also get daily emails with market news and potential advance that they may want to keep their eye on relating to their portfolio.
IBD employs what they call CANSLIM strategy.
What is their CANSLIM Model?
This strategy has elements of fundamental trading, which aims to help you be a more efficient technical Trader.
CANSLIM is an acronym that stands for the following:
Current quarterly earnings
Quarterly earnings are very important litmus tests for publicly traded companies because they are a small snapshot of their financial performance over the past quarter.
Sometimes investors get too caught up in quarterly earnings and ignore everything else, but the other factors in this list, they provide additional color to your investment decision.
Annual earnings growth
Quarterly earnings are a small snapshot of the company’s annual earnings growth performance.
It is a great way to connect the company’s annual performance with its industry benchmark to see if it’s meeting or exceeding expectations.
New products or services
Is this company innovative and releasing new products and services to serve their customers?
Or are they resting on their laurels?
Supply and demand
Supply-demand for a stock may sound weird, but you need to look at the trading volume and price action to see how other traders are looking at it.
Leader or laggard
Is this particular stock leading its industry, or is it falling behind?
Institutional sponsorship
When institutional investors like Berkshire Hathaway or insurance companies take a stake in a company, it can be a good indicator of what the industry at large thinks about that specific stock.
Market direction
Simply put, this is asking where the market is going for this company?
When you are trading using technical analysis, you may want to get some more information on the trading stocks.
This framework provides an accessible and very manageable way to do some quick research.
My IBD Summary
My conclusion is that there is just too much information and I find their webpage somewhat difficult to use.
The Leaderboard 50 is a great idea, but honestly it seems to make too many trades in and out each week for me to keep up with. Take a look at the last week:
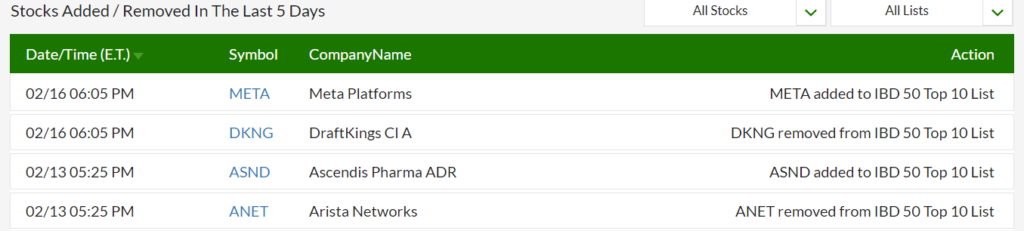
So they made 4 recommendations this week, removing DKNG and ANET and adding META and ASND. They average about 6 trades a week so that is about 300 trades a year. That’s just too much.
They don’t make it easier to determine the results of this Leaderboard. But there is an ETF that does make all these trades and look how it has done.
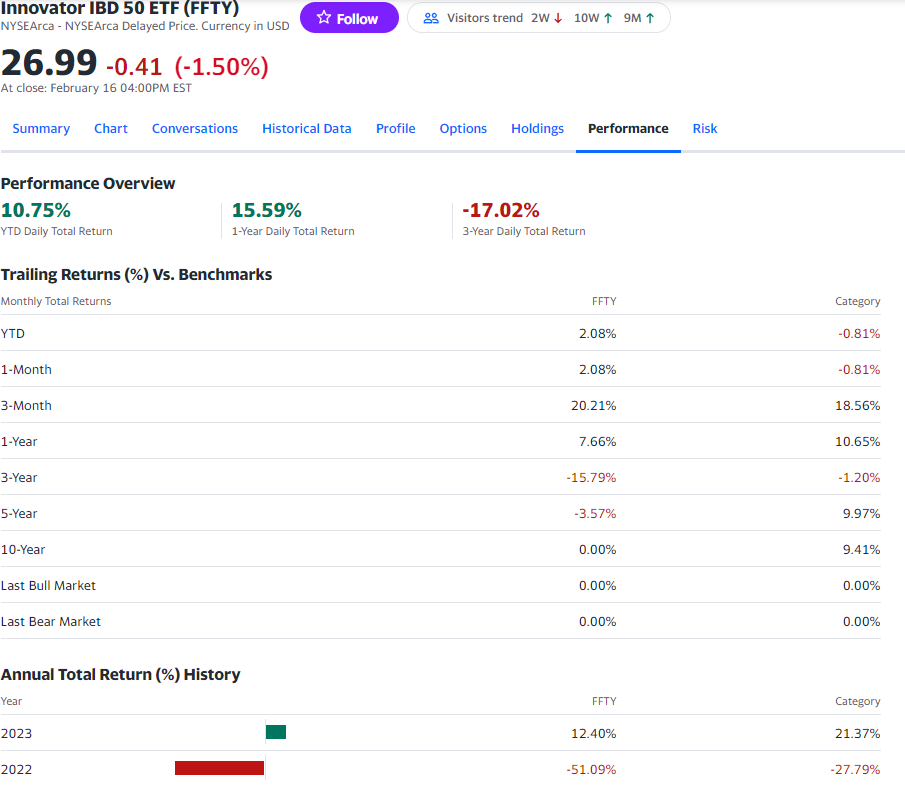
The last 3 year average is -15% vs -1% and for the last 5 years the average return is -3.57% vs 9.41%. That is NOT a glowing recommendation.
Motley Fool Stock Advisor
The Motley Fool was founded in the late 1990s by brothers Tom and David Gardner.
At the time, there were not many resources available to retail investors.
In fact, most of the financial data in stock market analytics was only available to Wall Street professionals.
Motley Fool decided to start their Stock Advisor newsletter to provide information and reliable stock picks to everybody who would subscribe affordably.
Stock Advisor is aimed at long-term investors who prefer using “buy and hold” strategy. They specifically say you need to plan on holding their stocks for at least 5 years. If you are reading negative comments they are from people that are looking for a quick buck–and that is NOT what the Fool is all about. I have been a subscriber since 2016 and I buy about $1,500 of all of their 24 picks each year. Take a look at the chart below:
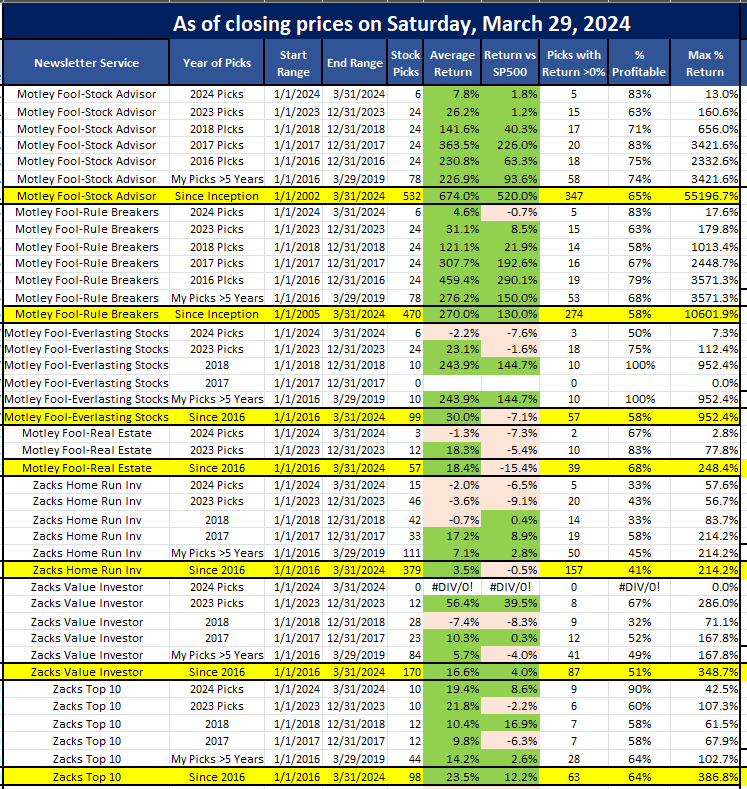
This pretty much proves that holding their stocks for at least 5 years is the strategy that works with the Motley Fool Stock Advisor picks and their Rule Breakers picks.
This also shows that the IBD picks are really struggling to beat the market while the Motley Fool’s picks are crushing the market.
So, what do you get with Stock Advisor?
All subscribers receive:
- Two stock picks per month;
- Access to the starter stock list; and
- Other recommendations from the Motley Fool analysts.
Tom and David each have their team of analysts, and they each employed different stock valuation methods.
The teams spend each month sifting through their list of top potential stocks.
From there, each team settles on what they think is the best stock to recommend for their subscribers.
Since they perform their analysis independently, they are able to offer an immense range of perspectives on all the stocks.
Additionally, the teams provide the data they use to make the decision.
Sometimes, the teams settle on the same stock without telling each other.
This occurrence has only happened a handful of times.
When it happens, it is called an “ultimate buy“ recommendation.
The starter stock list is a group of stocks that:
- Are in different industries;
- Have different market capitalization; and
- Have a strong track record.
If you’re looking for new stocks, but don’t know how to start searching, this starter stock list is great for anyone.
The list is diversified and it has representation in a variety of different sectors.
The Motley Fool also provides another list of potential stock recommendations.
These recommendations have promising potential and include the analysis that was used to pick them.
Why Moby May Be the Next Motley Fool…
Motley Fool has had the best run historically…
Moby is looking like the new age Motley Fool (beating the S&P 500 by 8.3% over the last 3 years)
Read our Moby review & see why we think this might be the next Motley Fool.
Motley Fool and IBD Performance and others…
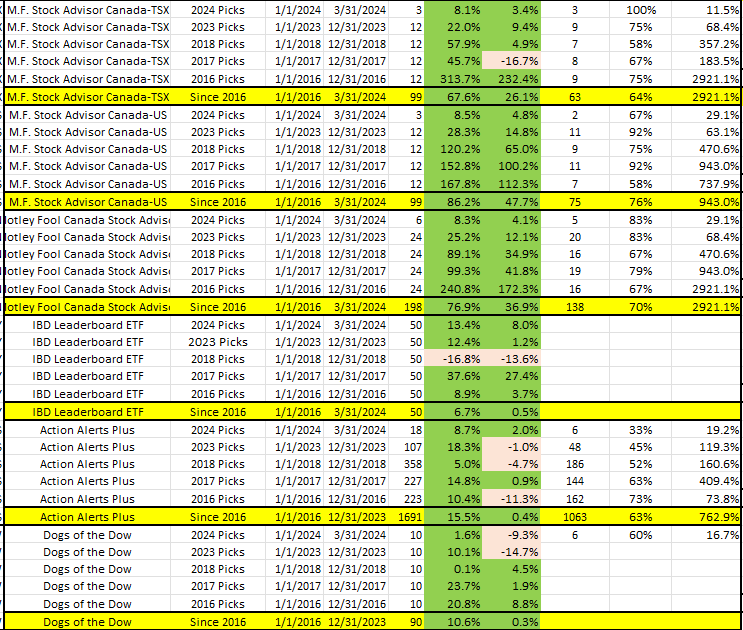
Ok, so here is that you are waiting for.
Take a look a the performance of these 2 for their 2023 picks as of January 1, 2024.
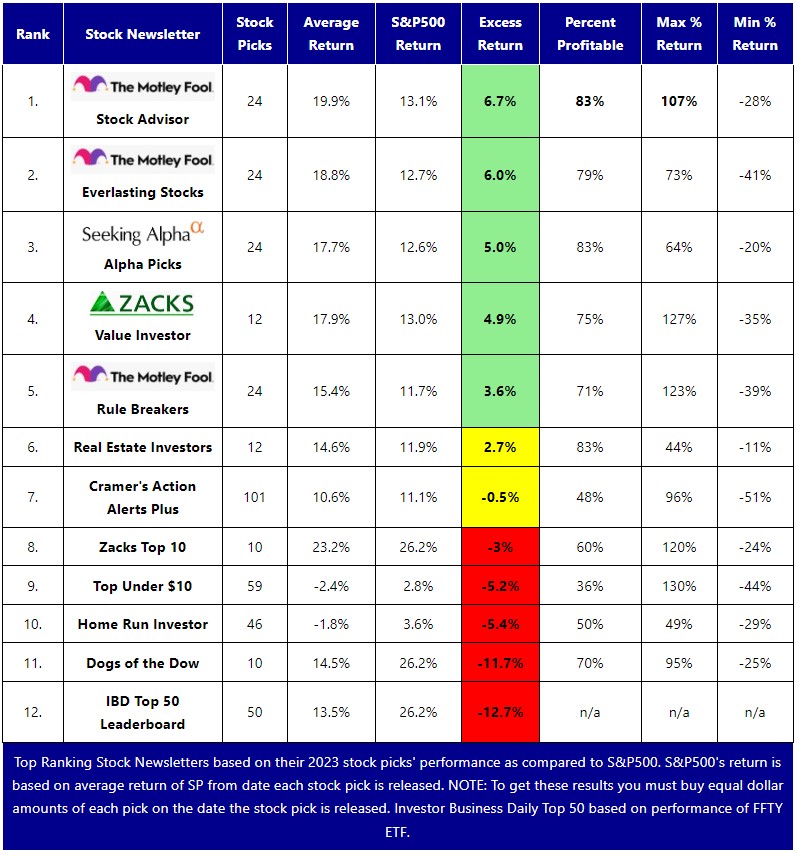
Which one should you go for?
In our analysis of Investor Business Daily (IBD) versus Motley Fool, we conclude that Motley Fool’s Stock Advisor is a superior choice for most investors. And by “investors” we mean those who are investing for the long term. Specifically, the Motley Fool says you should plan on holding their stocks for 5 years.
This is because Stock Advisor caters to a wide range of financial backgrounds, making it the most accessible option. While IBD’s leaderboard offers valuable resources for experienced technical traders and short term traders, its complexity can be overwhelming for those seeking to build a straightforward, long-term investment strategy.
For both newcomers and seasoned investors seeking additional resources and potential investments, Motley Fool’s Stock Advisor effectively meets these requirements.
Their starter stock list serves as an excellent introduction to portfolio theory and diversification, while the monthly stock picks from Motley Fool offers investment insights into new industries.Try Motley Fool Stock Advisor, which comes with a money-back guarantee, offering a risk-free opportunity to test their service.
*** UPDATE -- Sunday, August 2, 2026 -- MOTLEY FOOL STOCK ADVISOR AVERAGE RETURN OF ALL 500+ STOCK PICKS IS 916% VS THE S&P500'S 210% ****
The Fool investing philosophy is hold stocks for at least 5 years, invest regularly, and ride out the dips. Here is just a sample of some recent picks:
- Comfort Systems (FIX) picked Dec 4, 2025 and already up 60%
- Sterling Infrastructure (STRL) picked Sept 4, 2025 and up 53%
- Rocket Lab picked August 7, 2025 and already up 88%
- BridgeBio Foods picked June 17, 2025 and already up 81%
- ASML picked March 20, 2025 and already up 94%
- Howmet Aerospace picked January 16, 2025 is up 102%
- Transmedics picked December 19, 2024 is up 69%
- Guardant Health picked June 11, 2024 is now up 189%
Also, the Motley Fool just launched a July, 2026 promotion: $250 off on 2 year subscription and $100 on 1 year subscription (see the link below).
Here is their release schedule of their upcoming stock picks:
- July 2, 2026 - New Stock Recommendation
- July 9, 2026 - List of 5 Best Stocks to Buy Now List
- July 16, 2026 - New Stock Recommendation
- July 23, 2026 - List of 5 Best Stocks to Buy Now
So, if you have a few hundred dollars to invest each month and plan on staying invested for at least 5 years, we haven't found any better source of stock picks.
New Pricing: Motley Fool has slashed the price for its top stock picking service.
Get $250 off HERE