
With more platforms entering the trading space every year, investors need clarity on which apps are safe, feature-rich, and worth their time. This moomoo review takes a close look at one of the fastest-growing trading platforms in 2026. Designed for both beginners and advanced users, moomoo provides tools for stock trading, options trading, and more, all while eliminating inactivity fees and minimum deposit requirements.
And, if you are looking to open a new brokerage account, moomoo has one of the best incentives for new accounts. Yes, get free NVDA stock when you open an account. Deposit $500 to get $30 in stock, deposit $2,000 to get $100, etc.
Open a new account and earn up to $1,000 in NVDA stock with a qualified deposit
- Commission-free trading on U.S. stocks, ETFs & options
- Earn up to 8.1% APY on uninvested cash via cash sweep program
- Free real-time Level 2 quotes & 50+ advanced charting tools
- Paper trading simulator to practice strategies risk-free
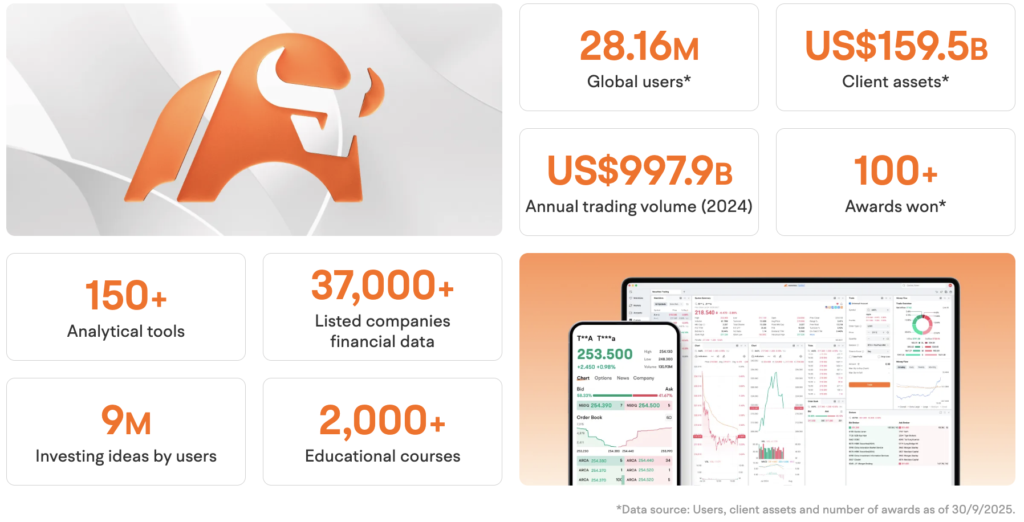
- 28M+ global users; FINRA & SIPC regulated up to $500,000
We’ll explore moomoo’s key features, fee structure, account types, research tools, and educational content. Whether you’re seeking commission-free trades or full-service portfolio tools, this review will help you decide if opening a moomoo account is right for you.
Introduction to Trading Platforms

Moomoo is a modern brokerage account platform that allows users to trade stocks, ETFs, options, cryptos and fixed income securities.
Operated by Moomoo Financial Inc and Moomoo Technologies in New Jersey, USA, moomoo is regulated by the Financial Industry Regulatory Authority (FINRA) and is a member of the Securities Investor Protection Corporation (SIPC). These affiliations signal strong regulatory oversight and important safeguards for investors.
The moomoo app and web trading platform are available on desktop and mobile. Both interfaces are clean, professional, and highly customizable. They appeal to new users as well as experienced traders.
Their platform has won many BEST OF awards for its design and ease of use.

Recently, moomoo has also introduced AI-powered features designed to enhance the trading experience. These tools help traders with smarter stock analysis, market insights, and data-driven signals by processing large volumes of market information in real time. The AI functionality supports better decision-making for both beginners and experienced traders by highlighting trends, risks, and potential opportunities across the stock market.
One of the biggest selling points is that moomoo offers commission-free stock trading on U.S. equities without imposing hidden costs, inactivity fees, or deposit requirements.
And you can see that over 28 million global users trust moomoo with their accounts.
Key Features of Moomoo
Moomoo provides a comprehensive trading suite. Here are the major features that set it apart:
- Investment products include stocks, ETFs, options, crypto, and bonds
- Real-time financial news feeds and global market summaries
- Portfolio diversification tools such as watchlists, sector overviews, and customizable alerts
- A cash sweep program that earns up to 8.1% APY on uninvested cash
- A well-organized desktop platform, mobile platform, and browser-based web trading platform
Moomoo is currently offering 8.1% APY!
With the WallStreetSurvivor Exclusive offer on this page, earn up to $1,000 in NVDA stock with a qualified deposit.
Canada Residents: You can win a trip to New York City, a free iPhone 17 Pro, $100, etc on this Canada Promo Page!
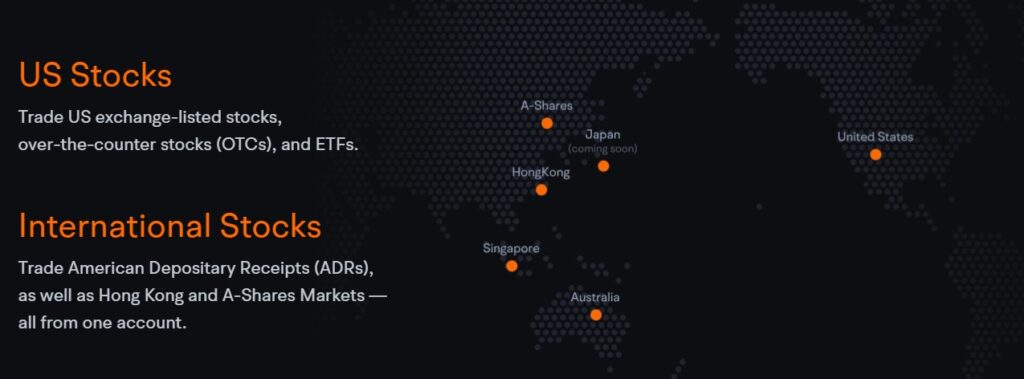
All platforms support a unified trading experience with synchronized watchlists, one-click trades, multi-screen charting, and access to global markets including Australia, Hong Kong ,and the Singapore market.
Moomoo’s New Crypto Trading Features
Moomoo recently expanded into cryptocurrency trading, giving users the ability to diversify their portfolios beyond traditional stocks and ETFs. Through its new crypto trading interface, investors can now buy and sell a curated list of over 50 digital assets, including Bitcoin, Ethereum, and a handful of other top-tier coins.
While the selection is currently limited compared to larger crypto exchanges, the rollout prioritizes compliance and ease of use—ideal for traders who want to explore crypto without leaving the Moomoo ecosystem. You’ll get real-time price updates, basic charting tools, and competitive spreads, all within the same app you already use for equities and options. This move puts Moomoo on the radar for crypto-curious investors looking for a secure, all-in-one platform.
Platform Overview
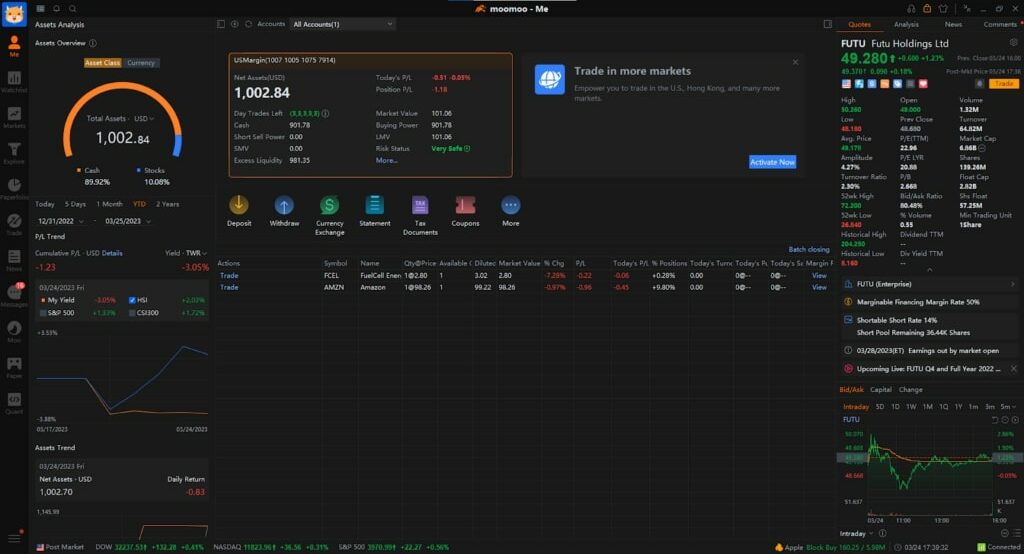
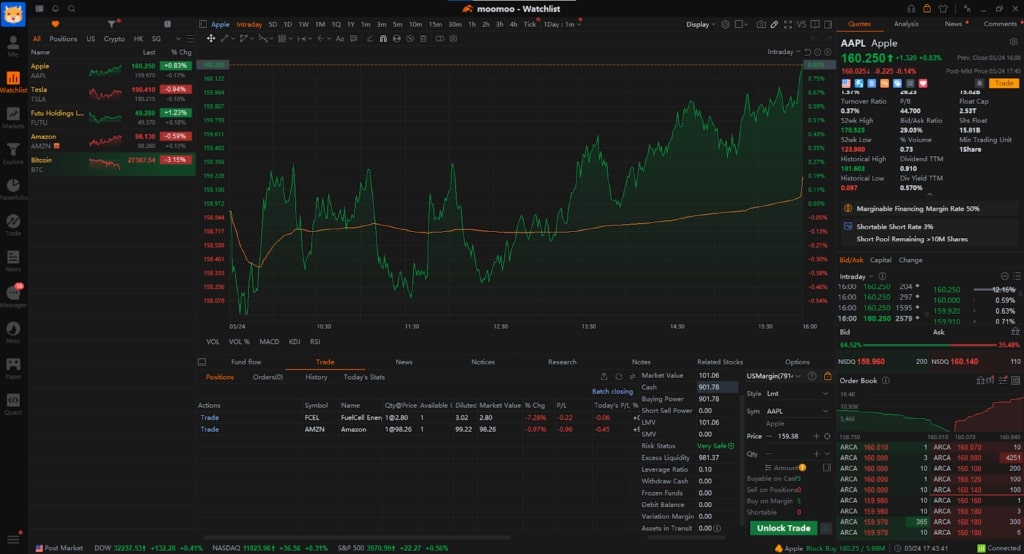
The moomoo platform is designed for efficiency across both mobile and desktop experiences. On the desktop side, moomoo includes real-time Level 2 quotes and customizable screeners that allow investors to filter stocks based on technical and fundamental indicators. The charting interface includes more than 50 built-in tools for analyzing trends, making it ideal for experienced traders who want a more granular view of price action.
On mobile, the moomoo app is optimized for speed and convenience. Users can set instant price alerts, monitor live market depth, and execute trades directly from their device with minimal lag. The app also features real-time trade analytics, helping traders assess the impact of their positions throughout the day.
The moomoo website brings everything together with centralized access to customer support, account management, and educational materials. The cross-platform integration means investors can start a trade on their phone and finish it on their desktop, or vice versa, with no interruption. This seamless user experience makes moomoo a practical solution for both active and long-term investors.
Fees and Charges
Here is a breakdown of moomoo’s fee structure as of May 2025:
| Trade/Service | Fee |
|---|---|
| Annual fee | N/A |
| Inactivity fee | N/A |
| Index options | $0.50 per contract |
| Margin rate | 6.8% |
| American Depository Receipts | $0.02 to $0.05 per share |
| ACAT transfers (transfers to another brokerage) | $75.00 |
| Broker-assisted trades | $10.00 |
- Stocks and ETFs: Commission-free for U.S. residents
- Options trading: Commission-free with no contract fees on U.S. equity options; $0.50 per contract for U.S. index options
- Mutual funds: Fees vary by provider
- Other fees: No deposit fees, withdrawal fees, or account maintenance charges
This pricing makes moomoo one of the most transparent platforms available. You can withdraw money freely, manage your bank account connections, and avoid hidden charges.
If you want to learn more about the perks that come with joining moomoo, check out moomoo Free Stock.
Account Management
Moomoo supports several account types, including:
- Individual brokerage accounts
- Retirement accounts (Traditional and Roth IRAs)
Joint accounts are not currently supported. All accounts come with real-time monitoring tools and alerts. Users can:
- View holdings and portfolio performance at a glance
- Set up risk alerts and notification thresholds
- Access monthly statements and tax documents
Customer service is accessible via phone support, email, or in-app live chat.
Research and Data Tools
Moomoo excels when it comes to delivering investment research and market intelligence. Users gain access to:
- Advanced charting for technical analysis
- Stock screeners and heat maps
- Research reports on trending stocks
- Analyst ratings, earnings forecasts, and price targets
- Real-time quotes and financial news integration
Moomoo is currently offering 8.1% APY!
With the WallStreetSurvivor Exclusive offer on this page, earn up to $1000 in NVDA stock with a qualified deposit.
Canada Residents: You can win a trip to New York City, a free iPhone 17 Pro, $100, etc on this Canada Promo Page!
These tools support both personal research and trade validation. Moomoo also integrates asset lookup functions and sector snapshots.
Educational Resources
Moomoo provides a robust library of educational resources designed to help investors develop their skills and deepen their understanding of the markets. The platform includes step-by-step tutorials that guide users through the functionality of the app and web interface, making it accessible for traders at any level.
Live and recorded webinars cover topics such as current market conditions, investing strategies, and risk management. These sessions are led by market experts and are regularly updated to reflect the latest trends and economic data.
A built-in paper trading simulator allows users to practice without risking real money. This feature is especially valuable for new investors who want to test strategies and become comfortable with the platform before making actual trades.
In addition to platform training, moomoo also provides clear explainers on key financial concepts, including options trading, portfolio diversification, and fixed income securities. These resources help both beginner investors and seasoned traders build confidence and improve their decision-making skills.

Security, Regulation, and Insurance
Moomoo prioritizes safety and transparency. Investors benefit from:
- FINRA and SEC oversight
- SIPC protection up to $500,000 per account, including $250,000 for cash
- Encrypted bank account integration
- Optional two-factor authentication
- Real-time fraud detection alerts
Funds in the cash sweep program may qualify for FDIC insurance, offering additional protection for eligible users.
Pros and Cons of Using Moomoo
Choosing the right brokerage platform is about more than just cost. It’s about the combination of pricing, tools, usability, and support that fits your goals. Moomoo delivers on many of these fronts, but like any platform, it comes with a few trade-offs worth noting.
Pros:
- Commission-free stock trading and options for U.S. equities
- Strong regulatory protection (FINRA, SIPC)
- Real-time data and insights with advanced charting tools
- No minimum deposit to start and no inactivity fees
- Rich features across desktop and mobile platforms
- Extensive educational content and a supportive learning environment for new investors
Moomoo is currently offering 8.1% APY!
With the WallStreetSurvivor Exclusive offer on this page, earn up to $1000 in NVDA stock with a qualified deposit.
Canada Residents: You can win a trip to New York City, a free iPhone 17 Pro, $100, etc on this Canada Promo Page!
Moomoo stands out because it combines low fees with deep functionality. The platform brings institutional-quality tools to everyday investors without charging for core services. Its fast execution speeds and data integrations allow users to react quickly to market changes. For active traders, the real-time insights and Level 2 data are a significant value add.
Cons:
- Mutual fund offerings may carry third-party fees, making them less competitive than ETFs
- Interface may challenge new users who are unfamiliar with technical setups or multi-tab trading environments
That said, the platform offers enough educational resources and support to help users overcome the learning curve. Investors who want a balance of power and education without the cost of a traditional brokerage may find moomoo well suited to their needs.
Is Moomoo Safe and Legit?
Yes. Moomoo is operated by Futu Holdings, a NASDAQ-listed firm. It is regulated by FINRA and the SEC, and is a SIPC member. SIPC protection secures user accounts in case of platform failure, covering up to $500,000.
Although no platform can guarantee future results, moomoo applies rigorous security measures, strong encryption, and user protection policies that meet or exceed industry standards.
Who Should Use Moomoo?
Moomoo is a platform that serves a wide spectrum of investor needs, but it is especially well-suited for those who want a flexible, research-driven experience. New users will appreciate the platform’s ease of entry with no minimum deposit requirements, as well as the guidance provided through its educational materials and simulated trading tools.
Intermediate investors will benefit from moomoo’s extensive data integrations, technical analysis features, and low-cost structure, which allows for regular trading without accumulating excessive fees. The platform also supports access to international markets, including the Singapore market, making it attractive for those looking to expand their global exposure.
While moomoo just recently added fractional shares, the trade-off is a more robust suite of tools and insights than many low-cost platforms provide. For users who prioritize education, hands-on research, and active portfolio management, moomoo delivers a versatile and responsive trading environment.
Final Verdict
Moomoo delivers an all-in-one platform for investing in stocks, options, ETFs, cryptos and bonds. Its transparent pricing, strong regulatory backing, and full-featured app make it a strong choice for U.S.-based and international investors.
While it does not offer everything, such as a full range of mutual funds, it does excel in platform flexibility, research access, and ease of use.
With robust tools, SIPC protection, and a solid interface, moomoo continues to build a strong reputation among both retail and professional investors.
FAQs
Yes. Moomoo is a member of the Securities Investor Protection Corporation (SIPC), which covers accounts up to $500,000. Yes, we believe moomoo is safe for beginners. Make sure to read the Terms of Service completely before you make your first trade.
Yes. Moomoo is regulated by the Financial Industry Regulatory Authority (FINRA) and the Securities and Exchange Commission (SEC).
Moomoo offers commission-free trading. In most cases, it’s totally free to buy and sell stocks, ETFs, REITs, and US treasuries on moomoo. There are small fees for things like index options, but in almost every case, moomoo’s fees are lower than those of their competitors.
Yes. Moomoo offers strong educational resources and a paper trading account to help users learn the basics.
Top U.S. Brokers Promotions for 2026
★ ★ ★ ★ ★
✅ Now 23 million users
✅ Cash mgt account and credit card
Free stock up to $200 with new account, plus more free stock with referrals; US residents only.
Open Account &Get Free Stock
★ ★ ★ ★ ★
✅ $50 minimum when opening account
✅ Cash mgt account and credit card
Get up to $1,000 in free stock with new account. US residents only.
Open Account &Get Up To $1,000 in free stock.
★ ★ ★ ★ ★
✅ Access to U.S. and Hong Kong markets
✅ Educational tools
Deposit $500 get $30 in NVDA stock; Deposit $2,000 get $100 in NVDA stock; Deposit $10,000 get $200 in NVDA stock; Deposit $50,000 get $400 in NVDA stock.
Get Free Shares★ ★ ★ ★ ☆
✅ Trade U.S. stocks, ETFs, and crypto
✅ Trades with themed portfolios
★ ★ ★ ★ ☆
✅ Great charts and screeners
✅ Commission-free options trading
$10 and a 30-day complimentary subscription to Webull premium; $200-$30,0000 Tiered Sign up bonus
Learn more★ ★ ★ ★ ☆
✅ IBKR Lite & Pro tiers for all
✅ SmartRouting™ and deep analytics
The Best Canadian Brokerages as of July 1, 2026
Ranking of Top Canadian Stock Brokerages Based on Fees, Features, and Sign-Up Bonuses
We are experienced users of dozens of Canadian stock trading platforms. We stay up to date on these platforms' service offerings, subscription fees, trade commissions, and welcome bonuses. The brokerages listed below are for Canada-based investors, and are ranked in order of overall value received after taking advantage of their sign-up and/or referral offers.
✅ Dual-currency accounts without conversion fees
✅ Advanced trading with multi-leg options support
✅ Tiered interest on idle cash balances over $10,000 CAD
✅ Supports portfolio margin and direct market routing
✅ Access to Canadian Markets
✅ RRSP and TFSA Accounts
Deposit $100, get $20 in NVDA stock; Deposit $2,000, get $50 in NVDA stock; Deposit $10,000, get $300 in NVDA stock; Deposit $50,000, get $1,000 in NVDA stock
Learn more✅ In-kind transfers & dividend reinvestment plans for CA stocks
✅ RESP and FHSA accounts with self-directed tools
✅ 24/5 U.S. market access with fractional share support
✅ No FX fees on U.S. trades if subscribed to USD feature
Fees, features, sign-up bonuses, and referral bonuses are accurate as of July 1, 2026. All information listed above is subject to change.