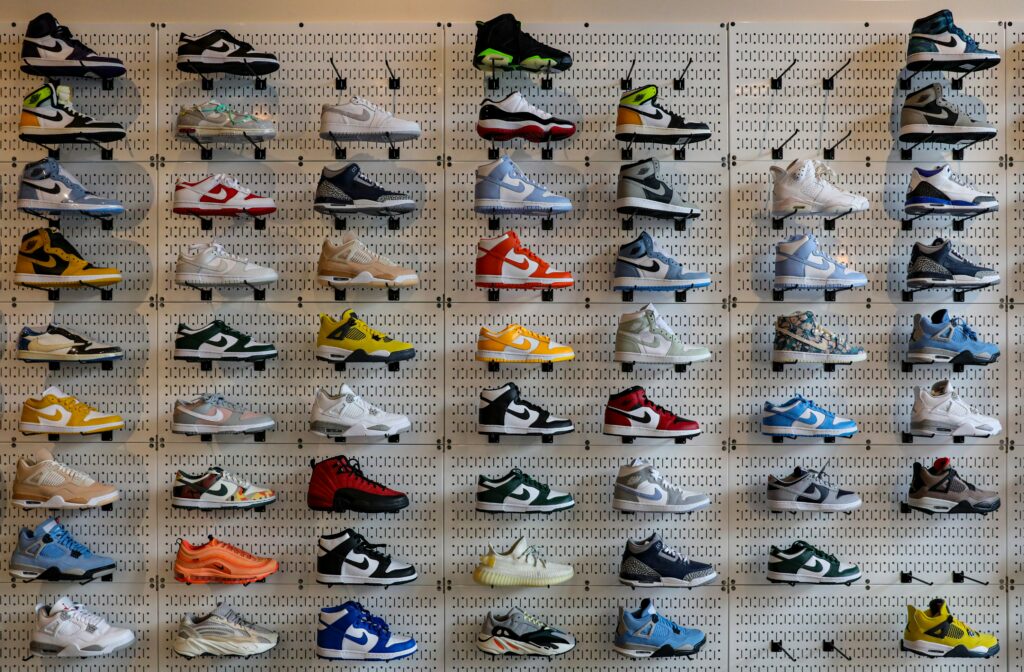
When the Travis Scott Jordan 1s dropped for $175, resale hit $1,500 in days. The Off-White Chicago Jordan 1s? Retail: $190. Resale today: nearly $5,000. Even Yeezy 350s, once the holy grail of sneaker flipping, turned $220 retail into $600 overnight.
It’s no wonder sneaker culture feels like investing. Buy low, hold or flip, profit. But what if you took that same money—and sneakerhead discipline—and put it into the stock market instead?
Let’s do the math.
Sneaker Hustle vs. Market Muscle: Investing for Beginners
Say you buy one hyped sneaker every month for around $250 retail. Over a year, that’s $3,000—not counting raffles, bots, or L’s.
For investing for beginners, the simplest move is to pay off high-interest debt, build a small emergency fund, set a monthly budget and a clear goal, then invest that money consistently—often through tax-advantaged accounts—into diversified assets based on their risk and return instead of chasing short-term hype. Stocks have historically offered strong long-term growth potential, but they also carry higher risk, which is why beginners are usually better served by diversified investing than by betting on a single winner.
If you’re new to investing—especially if sneaker reselling already makes sense to you or you’re looking for a more reliable way to grow wealth over time—this comparison shows what happens when that same $250 goes toward long-term compounding and dollar-cost averaging rather than your next pair.
Best-case scenario? You flip half your pairs and double your money. That’s about $1,500 in profit—a nice return, but inconsistent and time-consuming.
Now imagine taking that same $250 per month and investing it in a diversified fund such as an S&P 500 index fund or ETF—no bots, no resale fees, no guessing next season’s collab. At a 10% annual return, here’s what that looks like:
| Starting Age | Monthly “Sneaker Budget” | Value at 65 | Sneaker Equivalent |
|---|---|---|---|
| 20 | $250 | ≈ $1.6 million | 1 pair/month instead invested |
| 25 | $250 | ≈ $1.0 million | 5 fewer years of drops |
| 30 | $250 | ≈ $620,000 | That’s 120 pairs of Jordans’ worth |
Even a smaller monthly “cop” of $100 becomes roughly $640,000 by 65. The hype fades; compounding doesn’t. Taking the long view is how beginners grow wealth, keep up with inflation, and build lasting financial freedom.
That gap is the point: compared with sneaker flipping, consistent investing is usually more reliable, less hands-on, and far more powerful over decades. From here, we’ll break down stock-market investing versus sneaker reselling, how compounding and diversification work, and practical beginner steps for asset allocation, portfolio building, and using steady research and commitment to turn regular contributions into long-term wealth.
The ROI of Real Assets in Your Investment Strategy
Let’s look at a few iconic pairs and compare:
| Sneaker | Retail Price | Peak Resale Value | ROI | 10-Year S&P 500 Equivalent* |
|---|---|---|---|---|
| Off-White x Air Jordan 1 “Chicago” (2017) | $190 | ~$4,800 | +2,426% | +~170% |
| Travis Scott x Air Jordan 1 Low “Mocha” (2019) | $150 | ~$1,400 | +833% | +~170% |
| Nike SB Dunk Low “Chunky Dunky” (2020) | $120 | ~$1,600 | +1,233% | +~170% |
| Yeezy Boost 350 “Turtle Dove” (2015) | $220 | ~$900 | +309% | +~170% |
| Air Jordan 1 “Bred” (2016 Retro) | $160 | ~$600 | +275% | +~170% |
| New Balance 550 “Aime Leon Dore” (2021) | $130 | ~$300 | +131% | +~170% |
| Nike Air Jordan 11 “Concord” (2018) | $220 | ~$300 | +36% | +~170% |
As one example, these standout pairs show how celebrity collaborations, limited supply, and strong consumer desire can push prices far above retail. In the sneaker market, resale platforms like StockX and stadium goods help investors track trends, compare trade activity, and make sharper investment decisions. That can be an advantage when you spot demand early, but market fluctuations, market volatility, and fees can cut into potential returns. Buyers also need to judge what to pay up front, how much income they can realistically commit, and how eco friendly materials or shifting tastes may shape future demand.
A few pairs skyrocket, most plateau—and some even lose value after restocks or hype cycles fade. The sneaker game rewards short-term timing; the stock market rewards long-term patience. They compound quietly, year after year.
What This Teaches Us About Asset Allocation
1. Both worlds require timing—but only one rewards time.Sneakers rely on perfect drops. Investing rewards staying invested
2. Diversify like a sneaker rotation.You wouldn’t only buy Dunks—so don’t only buy tech stocks. Diversify your portfolio like your closet: mix classics, new releases, and steady performers.
3. The real flex is financial freedom.Rocking grails is great—but owning shares of the brands behind them (Nike, Adidas, or even the S&P 500) builds lasting wealth.
4. Treat investing like sneaker culture.Do your research. Know the drops. Be consistent. Except this time, your “W” grows every year.
Let’s look at a few standout winners rather than typical results:
A few pairs skyrocket, but most do not. In a sneaker resale market worth about $6 billion in 2025, only 47% of releases are profitable, and profit margins for most pairs have compressed to 10–25%, so any extra income depends on spotting an early advantage before broader trends shift.
Many investors use resale platforms such as Stadium Goods to follow prices, compare trade activity, and make sharper investment decisions, but the future of returns still depends on market volatility. What buyers are willing to pay is also shaped by celebrity collaborations, demand for eco friendly materials, and changing tastes, and counterfeit sneakers can destroy value fast.
Final Word on Building an Investment Portfolio
You don’t have to give up sneakers to invest—you just have to rethink the game.
Flip one pair? Invest the profit. Skip one drop? Put that $250 into the market instead. If you ever add crypto, treat it as a small speculative slice because crypto investments are highly volatile and higher risk.
Because while everyone’s chasing limited releases, you’ll be building unlimited returns. Diversifying across stocks, bonds, and CDs helps manage risk: bonds are generally less volatile than stocks and provide steady income, while certificates of deposit pay guaranteed fixed interest rates. The earlier you start, the rarer your wealth becomes.
The real grail? A portfolio that buys every sneaker you’ll ever want—without guilt. In the sneaker market, spreading capital across multiple brands and models can reduce market volatility, and emerging labels can create an advantage by opening untapped margins tied to future demand signals like eco friendly materials.
Ready to learn the market without risking a cent?Wall Street Survivor gives you $100,000 in virtual cash to test your investing skills, join contests, and learn the market like a pro. Practice now—and build a collection that never goes out of style. Get started here!
We are paid subscribers to dozens of stock and option newsletters. We actively track every recommendation from all of these services, calculate performance, and share our results of the top performing stock newsletters whose subscriptions fees are under $500. The main metric to look for is "Return vs S&P500" which is their return above that of the S&P500. So, based on September 26, 2026 prices:
Best Stock Newsletters Last 3 Years' Performance
| Rank | Stock Newsletter | Picks Return |
Return vs S&P500 |
Picks w Profit |
Max % Return |
Current Promotion |
|---|---|---|---|---|---|---|
| 1. |  Alpha Picks |
+86% | +63% | 69% | 1,571% | October, 2026 Promotion: |
| Summary: 2 stock picks per month based on Seeking Alpha's Quant Rating; consistently beating the market every year since launch; tells you when to sell and they have sold almost half. One pick in the last 12 months is already up 467%. And 17 of their last 72 picks have doubled or more--with one up 1,571%. See their recent picks and detailed performance analysis in our Alpha Picks Review. NOTE: Their Fall Sale ends at the end of the month! Or get their Premium service to get their QUANT RATINGS on your stocks to better manage your current portfolio--read our Is Seeking Alpha Worth It? article to learn more about their Quant Ratings. |
||||||
| 2. |  Zacks Top 10 |
+32% | +14% | 74% | 170% | October, 2026 Promotion: $1, then $495/yr |
| Summary: 10 stock picks per year on January 1st based on Zacks' Quant Rating; Retail Price is $495/yr and includes 6 different services. Read our Zacks Review. Very good 77% accuracy. | ||||||
| 3. |  Action Alerts Plus |
+33% | +13% | 65% | 449% | Current Promotion: None |
| Summary: 100-150 trades per year, lots of buying and selling and short-term trades. Read our Jim Cramer Review. | ||||||
| 4. | Zacks Home Run Investor |
+10% | +5% | 45% | 333% | October, 2026 Promotion: $1, then $495/yr |
| Summary: 40-50 stock picks per year based on Zacks' Quant Rating; Retail Price is $495/yr. Read our Zacks Review. | ||||||
| 5. |  TipRanks SmartInvestor |
+14% | +4% | 59% | 268% | Current Promotion: Save 55% |
| Summary: About 1 pick/week focusing on short term trades; Lifetime average return of 355% vs S&P500's 149% since 2015. Retail Price is $379/yr. Read our TipRanks Review. | ||||||
| 6. | Zacks Value Investor |
+17% | +3% | 45% | 247% | October, 2026 Promotion: $1, then $495/yr |
| Summary: 10 stock picks per year on January 1st based on Zacks' Quant Rating; Retail Price is $495/yr and includes 6 different services including those below. Read our Zacks Review. Low 44% is a bit alarming given the bull market. | ||||||
| 7. |  Moby.co |
+36% | 2% | 63% | 1,212% | October, 2026 Promotion: Get Current #1 Pick Free |
| Summary: 60-150 stock picks per year, segmented by industry; consistently beating the market every year; retail price is $199/yr. Read our Moby Review. | ||||||
| 8. | IBD Leaderboard ETF | 11% | -1.8% | n/a | n/a | October, 2026 Promotion: NONE |
| Summary: Maintains top 50 stocks to invest in based on IBD algorithm; Retail Price is $495/yr. Read our Investors Business Daily Review. | ||||||
| 9. | Zacks Under $10 |
+1.9% | -2% | 38% | 263% | October, 2026 Promotion: $1, then $495/yr |
| Summary: 40-50 stock picks per year based on Zacks' Quant Rating; Retail Price is $495/yr. Read our Zacks Review. | ||||||
| 10. | Dogs of the Dow Strategy | +8% | -10% | 80% | 34% | Current Promotion: None |
| Summary: Buy the 10 highest yielding dividends stocks in the Dow Jones Industrial Average on January 1st and sell on Dec 31st each year. | ||||||
| 11. |  Stock Advisor |
+21% | -12% | 56% | 361% | October, 2026 Promotion: Get $100 Off |
| Summary: 2 picks/month and 2 Best Buy Stocks lists focusing on high growth potential stocks over 5 years; Retail Price is $199/yr. Read our Motley Fool Review. | ||||||
| 12. | Rule Breakers |
+34% | -14% | 58% | 494% | Current Promotion: Save $200 |
| Summary: Rule Breakers is included with the Fool's Epic Service. Get 5 picks/month focusing on disruptive technology and business models; Lifetime average return of 355% vs S&P500's 149% since 2005; Now part of Motley Fool Epic. Read our Motley Fool Epic Review. | ||||||
| Top Ranking Stock Newsletters based on their last 3 years of stock picks covering 2026, 2025, 2024, and 2023 performance as compared to S&P500. S&P500's return is based on average return of S&P500 from date each stock pick is released. NOTE: To get these results you must buy equal dollar amounts of each pick on the date the stock pick is released. Investor Business Daily Top 50 based on performance of FFTY ETF. Performance as of September 26, 2026. | ||||||