
Introduction
Humans are great at recognizing patterns. But sometimes what we expect to happen, and what actually happens are different. So when investors expect a stock to post great earnings, failing to meet those expectations can causes drastic changes in the stock price.
No one likes surprises. Well, except for surprise birthday parties. Those are pretty awesome. But outside of that, we tend to set expectations for things before they happen. And businesses are no different.
What to Expect When Your Expecting
Before you receive your monthly financial updates from Terrific Tacos, you’ll probably have an expectation of roughly what the sales and profits numbers should be. These will be influenced by the trend you’ve seen over the previous months, the weather and any verbal feedback you’ve received from your business partner.
In the world of listed investments, this process of setting expectations is a bit more formal. In fact, an entire industry exists to forecast the future prospects for companies. Investors use these forecasts to make decisions on whether to invest, hold on to their investments, or sell them.
The media also drives expectations by creating hype around companies. Increasingly investors use social media to source and share ideas about companies. With the growth of social media, small time investors now have access to the world’s most competent finance minds.
It’s Value That Matters
A share price at any point in time, represents the equilibrium point where the number of buyers and sellers is equal. At that point, the market is agreeing on price, but not on value. Some participants are expecting higher prices and some are expecting lower prices.
Whether a share price rises or falls will depend on changing perception about how profitable a company is likely to be in the future. Analysts and investors need to dig through the financial statements to find clues as to how well a company can be expected to do in the future.
Expectations are driven by analyst forecasts, company guidance, and the financial media. They are also influenced by investor’s perception of the economy and equities in general. And, the expectation for each company is influenced by the results of other companies.
This chapter covers the process that analysts and the companies themselves follow during earnings season.
Analysts and Recommendations
If Terrific Tacos has its eye on domination of the world taco truck market, it will need some serious cash. And if a company needs lots of money invested, it needs to go to the big boys on Wall Street.
But, apart from being the street where the New York Stock Exchange is located, what is Wall Street? The term “Wall Street” is used as a collective noun for a group of investment banks and some other companies. There are three types of companies on Wall Street.
- Investment banks carry out mergers and capital raising for large companies
- Brokerages trade for clients and provide research – they are known as the “sell side” because they sell those services to their clients
- Fund managers manage money for individuals and pension funds – they are known as the “buy side” because they buy trading and research services from the sell side
Usually, all three types of businesses will be bundled together in a holding company such as JP Morgan, Bank of America or Goldman Sachs. Company, or equity, analysts are employed by both buy side and sell side firms.
Sell-side analysts publish research for their clients, although summaries of this research eventually make their way into the media.
Buy-side analysts conduct research for the benefit of the firms they work for. This research is used by fund managers and traders within the firms to make investment decisions. It is seldom shared outside the firm, though the marketing department might use it from time to time to show off the skills the firm employs.
So what do analysts do?
Well, analysts are usually qualified accountants, and many are chartered financial analysts too. Most specialize in specific sectors and may have specific industry experience. An analyst’s job is to learn everything there is to know about a handful of companies. They know the industry trends, all the factors which affect sales, costs and the market for the good or services those companies sell.
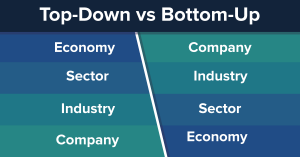
They will conduct a bottom-up and top-down analysis of each company. Bottom-up analysis looks at the company in isolation, while top-down research involves starting with the economy and drilling down to the sector, the industry, and the company. Top-down analysis is helpful in working out how much consumers will have available to spend. Bottom-up analysis is useful for determining how a company allocates its resources.
Analysts forecast the most likely path the financial performance of a company will take over the next three to five years. They will usually publish one or two comprehensive reports for each company they cover every year. And, every few months they may update their model and adjust their earnings forecasts.
First they will work out a forecast for a company’s earnings per share, dividends per share and a 12-month share price target. They will also look at the average PE ratio the stock trades at. They will use this PE and their earnings forecast to calculate a 12-month price target.
Based on these forecasts they will publish a recommendation for each share. Recommendations are usually either for investors to buy, sell, or hold a share.
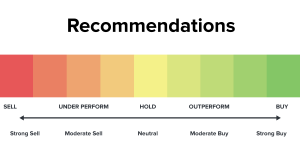
You may wonder why a share is worth holding if it is not worth buying. Well, the official answer is that if you already own a share you have already incurred certain transaction costs. The more cynical view would be that issuing a hold recommendation is a way of avoiding having to make a call.
Analysts also look at the investment prospects for a company relative to its sector and to the market as a whole.
As a result, there are numerous variations of the above recommendations. These variations include ‘market outperform’, ‘sector perform, ‘neutral’, and ‘underperform.’
The Whisper Number
We all know that’s it’s not a great idea to put all your eggs in one basket. If you wanted to invest your hard earned cash in a company, you probably wouldn’t go with just one opinion. Analysts have different views and you’d want to hear a second opinion. And a third. In fact, you’d probably want as many opinions as you can find. This is your savings we’re talking about.
Fortunately as an investor, you can get an average view. Financial news services collect forecasts and recommendations from all the prominent analysts in the industry. The averages of all these forecasts are known as:
Consensus estimates
When you hear something like: “The street is looking for 60 cents from Cisco,” what that means in English is; “The average earnings per share forecast from Wall Street analysts for Cisco is 60 cents.”
If the published earnings are better than the consensus estimate, that’s known as an earnings surprise or a beat. On the other hand, if actual earnings are below consensus that’s a negative earnings surprise or miss.
The example for Cisco above was from the second quarter of 2016. And, yes they beat “the street”, by reporting EPS of 63 cents. On the other hand, for the same quarter, Ford missed Wall Street’s consensus forecast, and the stock was sold heavily.
You can probably guess that when a company beats consensus the share price usually rises and when it misses the share price usually falls. But that’s not what always happens. We will look at why that might be later on.
In the good old days, when Wall Street didn’t have to worry about things like ethics and fairness, the brokers would publish two estimates; one for the man in the street and one for their favorite customers. This second number shared only with special customers was called the whisper number.

These days listed companies and brokers get into a lot of trouble if they don’t share information with everyone at the same time.
However, closer to the date of the results announcement that number may be informally updated. This might be the result of rumors or a result of a famous investor sharing his views. It may also be the result of similar companies publishing results which prompt a revision of various assumptions.
Also, company management may publish a profit warning or pre-announcement if they believe the actual number will be significantly different from what the market was expecting. This will happen when the statements are almost fully drawn up but have yet to be signed off by auditors.
A profit warning is a voluntary disclosure to cushion the effect of results that are either far better, or usually far worse than the market is expecting. They won’t necessarily say exactly what the number is, but will provide a range. Here’s an example of a profit warning from Swatch.
The Earnings Call
Alright, we’ve covered most of what transpires leading up to earnings dates. Now let’s take a look at what goes down when we reach that fateful day for a company.
A company’s financial results are submitted to the SEC and published via a press release to all major media houses. The exchanges on which the share is listed will usually also publish the press release on its website.
An earnings call will often be scheduled for later on the same day or for the next day. The earnings calls take the form of a conference call or sometimes a webcast. It is usually open to all shareholders and invited analysts. It may be open to the general public.
The objective for the conference call is to clarify details of the results and provide insight into the business strategy.
An earnings call is like a follow-up phone call after an email. It might be a little less formal, and you’ll have lots of questions. For Terrific Tacos, you might want to know what customer feedback has been like, and which locations have the highest traffic.
During an earnings call, the CEO and CFO (chief financial officer) will usually talk through the financial results and the business strategy. The call will then be opened to questions from analysts and major investors.
The financial details will already be in the public domain, so the most important aspects of an earnings call are qualitative rather than quantitative.
Some of the issues that investors will want to hear about are:
- The competitive landscape
- Costs
- Cost-cutting measures
- Pricing power – can the company increase prices faster than costs?
- Research and development
- New products on the horizon
- Management succession plan
- Failures within the business
An example: Google
Google’s quarterly results for the 4th quarter of 2015 are a good example of how an earnings call can change the perception of a share. Their results fell short of analyst expectations and the stock immediately fell 3%.
During the conference call, it emerged that part of that shortfall was due to currency losses. If a company makes money in an international market, those earnings are going to change if the dollar strengthens or weakens. So, for Google, this meant their earnings at the time of reporting took a knock.
It also emerged that there was a problem with inventory for their Nexus smartphones. Demand had been higher than anticipated, and their suppliers could not keep up. This meant that there was pent up demand which would translate into increased sales in the next quarter.
Both of these issues were temporary and not an indication that there were problems at the company. As a result, the share shot up 5 percent after the call.
Next up…we look beyond the company!
So far we’ve focussed on how company-specific news affects expectations and the share price. But, for investors to really get ahead of the game, they need to look at the business environment as well. We’ll have a look at some of the external factors in the next section.
Stocks and Sectors
Earnings season takes place four times each year, just after the end of each quarter. Each season starts two weeks after the end of the quarter and lasts for about three weeks. That’s the period when about 80 percent of companies report. As results from over 3000 companies are published, a picture of the corporate economy begins to emerge.
Earnings from each sector and from the largest companies can give investors clues as to how companies in other sectors may do. Share prices often begin to react as competitors release results.
These are a few of the factors investors will look for:
- Some sectors will show higher than expected sales while others fall short
- The effects of inflation will become apparent
- Whether consumer spending is increasing or decreasing
- The effect of the oil price will give clues as to whether inflation will increase
- Whether or not changes in interest rates are feeding into any sectors
Earnings season tends to affect the relationship between defensive companies and consumer discretionary companies.
Defensive companies are those that tend to do the same regardless of the economy. Companies that make everyday household products have relatively stable earnings. You don’t buy more toothpaste in a strong economy and less during a recession. For this reason, during weak economic periods, investors like to own these stable, if boring, companies.
Consumer discretionary companies are those that sell non-essential items like automobiles, electronics and holidays. These companies have more cyclical earnings than defensive companies.
If consumer discretionary companies report weaker than expected earnings, share prices of defensive companies will often rise, or outperform.
Some other relationships that investors keep and eye on:
- If corporate profits are good, that’s good for banks which make money from the rest of the economy
- Consumer spending is good for banks as more consumers make use of credit
- Manufacturing is good for mining companies as they source raw materials
- If travel companies do well, that’s good for airlines
You may be wondering how on earth you can keep track of all this. Well, an easy way is to look at which sector ETFs begin to outperform the market and which begin to underperform the market. The prices of sector indices and ETFs are always a good way to get an idea of what the market thinks of each sector.
There are thousands of ETFs around, but the “SPDR” products are excellent for sector specific ETFs. You can view the relative performance of the sectors on their homepage.
Forecasting
Analysts love Excel. They maintain complex Excel models for each company they cover, and during earnings season they pour over the financial results and update their models.
An analyst’s job is to forecast the future profitability of a company as accurately as possible. To do this they need a model for each company, and they need to keep tweaking this model to make sure it’s as accurate as possible. They’re never going to get it exactly right, but their career depends on them being amongst the best. So they need to learn as much as possible about the company.
During earnings season, they revisit all their assumptions and determine where they may have gone wrong. After rerunning all their calculations, they will usually publish an updated forecast for the following quarters and years.
Analysts will often have a face to face meetings with company management. Much of the analysis will be qualitative. They are not only interested in numbers but in how the business is doing. The more time they spend talking to management the more they can learn.
They will listen to recordings of the earnings call a few times. Sometimes it is not what’s said, but what is not said that can provide clues.
They will also look at the rest of the market for clues as to the environment their companies are likely to be operating in.
They will also give presentations to all their major clients and give a detailed breakdown of where they see each company going.
An Example: Terrific Tacos (Again!)
A wall street analyst probably wouldn’t cover Terrific Tacos. But, for the sake of this course let’s imagine they do.
The analyst has forecast a profit of $2000 for this month, $2,400 next month and $2,700 the following month.
The company discloses that the profit for this month is actually $2,400. If the business were a listed entity that would be good for the share price, right?
Well, when the analyst digs into the numbers he finds a problem. Food costs are soaring and in response, the company raised its prices. This meant it took in more money. However, most of the costs associated with the tacos sold were from ingredients ordered before prices increased. This meant the profit margin was based on higher retail costs and lower wholesale costs.
But, the analyst realizes that next month the higher input costs are going to cut into that margin and profits will be lower. He, therefore, issues a sell recommendation on the stock. The current share price just doesn’t reflect the likely profits for next month.

Next up…we look at how earnings season affects YOU, the investor
In this chapter, we looked at how analysts and investors study companies to get a picture of their future profitability. But, share prices are actually driven by the market and the market’s collective views on companies. So, it’s important to understand what the rest of the market thinks about a company too. In the next chapter, we’ll look at a couple of the tricks investors can use to get ahead of the game.
Rank of Top Stock Newsletters Last 3 Years, as of June 27, 2026
We are paid subscribers to dozens of stock and option newsletters. We actively track every recommendation from all of these services, calculate performance, and share our results of the top performing stock newsletters whose subscriptions fees are under $500. The main metric to look for is "Return vs S&P500" which is their return above that of the S&P500. So, based on June 27, 2026 prices:
Best Stock Newsletters Last 3 Years' Performance
| Rank | Stock Newsletter | Picks Return | Return vs S&P500 | Picks w Profit | Max % Return | Current Promotion |
|---|---|---|---|---|---|---|
| 1. | Alpha Picks | +108% | +85% | 72% | 1,571% | July, 2026 Promotion: See all their picks & get $124 off |
| Summary: 2 picks per month based on Seeking Alpha's Quant Rating; consistently beating the market every year since launch; tells you when to sell and they have sold almost half. See complete details in our Alpha Picks Review. Or get their Premium service to get their QUANT RATINGS on your stocks to better manage your current portfolio--read our Is Seeking Alpha Worth It? article to learn more about their Quant Ratings. | ||||||
| 2. |  Zacks Value Investor | +36% | +22% | 44% | 441% | July, 2026 Promotion: $1, then $495/yr |
| Summary: 10 stock picks per year on January 1st based on Zacks' Quant Rating; Retail Price is $495/yr and includes 6 different services including those below. Read our Zacks Review. | ||||||
| 3. | Zacks Top 10 | +36% | +22% | 77% | 170% | July, 2026 Promotion: $1, then $495/yr |
| Summary: 10 stock picks per year on January 1st based on Zacks' Quant Rating; Retail Price is $495/yr and includes 6 different services. Read our Zacks Review. | ||||||
| 4. |  Action Alerts Plus | +31% | +12% | 64% | 449% | Current Promotion: None |
| Summary: 100-150 trades per year, lots of buying and selling and short-term trades. Read our Jim Cramer Review. | ||||||
| 5. |  Moby.co | +39% | 10% | 62% | 1,566% | July, 2026 Promotion: Get #1 Stock Pick Free |
| Summary: All it requires is an email address to get their #1 stock pick free; 60+ stock picks per year, segmented by industry; consistently beating the market every year; retail price is $365/yr but save try it for $99. Read our Moby Review. | ||||||
| 6. |  TipRanks SmartInvestor | +19% | +8% | 57% | 361% | Current Promotion: Save $180 |
| Summary: About 1 pick/week focusing on short term trades; Lifetime average return of 355% vs S&P500's 149% since 2015. Retail Price is $379/yr. Read our TipRanks Review. | ||||||
| 7. | Zacks Home Run Investor | +10% | +5% | 42% | 427% | July, 2026 Promotion: $1, then $495/yr |
| Summary: 40-50 stock picks per year based on Zacks' Quant Rating; Retail Price is $495/yr. Read our Zacks Review. | ||||||
| 8. | IBD Leaderboard ETF | 11% | -1.8% | n/a | n/a | July, 2026 Promotion: NONE |
| Summary: Maintains top 50 stocks to invest in based on IBD algorithm; Retail Price is $495/yr. Read our Investors Business Daily Review. | ||||||
| 9. | Zacks Under $10 | +1% | -2% | 35% | 263% | July, 2026 Promotion: $1, then $495/yr |
| Summary: 40-50 stock picks per year based on Zacks' Quant Rating; Retail Price is $495/yr. Read our Zacks Review. | ||||||
| 10. | Dogs of the Dow Strategy | +6% | --7% | 50% | 34% | Current Promotion: None |
| Summary: Buy the 10 highest yielding dividends stocks in the Dow Jones Industrial Average on January 1st and sell on Dec 31st each year. | ||||||
| 11. | Stock Advisor | +7% | -17% | 59% | 141% | July, 2026 Promotion: Get $100 Off |
| Summary: 2 picks/month and 2 Best Buy Stocks lists focusing on high growth potential stocks over 5 years; Retail Price is $199/yr. Read our Motley Fool Review. | ||||||
| 12. | Rule Breakers | +11% | -18% | 51% | 208% | Current Promotion: Save $200 |
| Summary: Rule Breakers is included with the Fool's Epic Service. Get 5 picks/month focusing on disruptive technology and business models; Lifetime average return of 355% vs S&P500's 149% since 2005; Now part of Motley Fool Epic. Read our Motley Fool Epic Review. | ||||||
| Top Ranking Stock Newsletters based on their last 3 years of stock picks covering 2026, 2025, 2024, and 2023 performance as compared to S&P500. S&P500's return is based on average return of S&P500 from date each stock pick is released. NOTE: To get these results you must buy equal dollar amounts of each pick on the date the stock pick is released. Investor Business Daily Top 50 based on performance of FFTY ETF. Performance as of April 5, 2026. | ||||||