If you own a couple of index funds and a few stocks, you probably own more of some companies than you think. Morningstar X-Ray is the tool I use to check. It looks inside every fund you hold and adds it all up, so you see your real mix of stocks, bonds, sectors and regions.
If you’re new to why that mix matters, the SEC’s investor site has a short explainer on asset allocation and diversification. X-Ray is how you check yours.

Click the green button to apply the $50 discount automatically at checkout, bringing your first year to ~$199 instead of $249.
If the price still shows $249 at checkout, enter promo code PARTNER1 (or PARTNER) in the discount field to apply it manually.
- Independent research on 1,600+ mutual funds & ETFs, with no conflicts of interest
- Portfolio X-Ray reveals hidden overlaps, sector concentration & fee drag
- 120+ global analysts covering ~1,000 stocks with fair value estimates
- Advanced stock, fund & ESG screeners with 200+ data points
- Access via web, iOS & Android, with watchlists and portfolios syncing across devices
Try Morningstar X-Ray Free for 7 Days With Morningstar Investor
What is Morningstar X-Ray?
X-Ray is a portfolio analysis tool inside Morningstar Investor. Morningstar says it’s most useful when your portfolio holds several funds or ETFs, or a mix of stocks and funds. That’s where the overlap hides: two funds can own the same company, and a fund’s label doesn’t tell you what it actually holds.
You pick a view, choose a benchmark, and X-Ray fills in charts and tables comparing your portfolio to it. Every view has a Holdings Breakdown that shows which of your holdings is driving each number.
What Morningstar X-Ray shows you
| X-Ray area | What it tells you |
|---|---|
| Asset class | How your money splits across U.S. stocks, non-U.S. stocks, bonds and cash |
| Stock sector | How concentrated you are across 12 sectors |
| World regions | Your exposure to North America, Europe, Asia and the rest of the world |
| Fees and expenses | What your holdings cost, including the weighted average expense ratio |
| Stock stats | Ratios like price/book and price/earnings for the whole portfolio |
| Equity style box | How you’re spread across large, mid and small, value, core and growth |
| Fixed-income style box | Interest-rate sensitivity and credit quality of your bonds |
How I ran X-Ray on a test portfolio
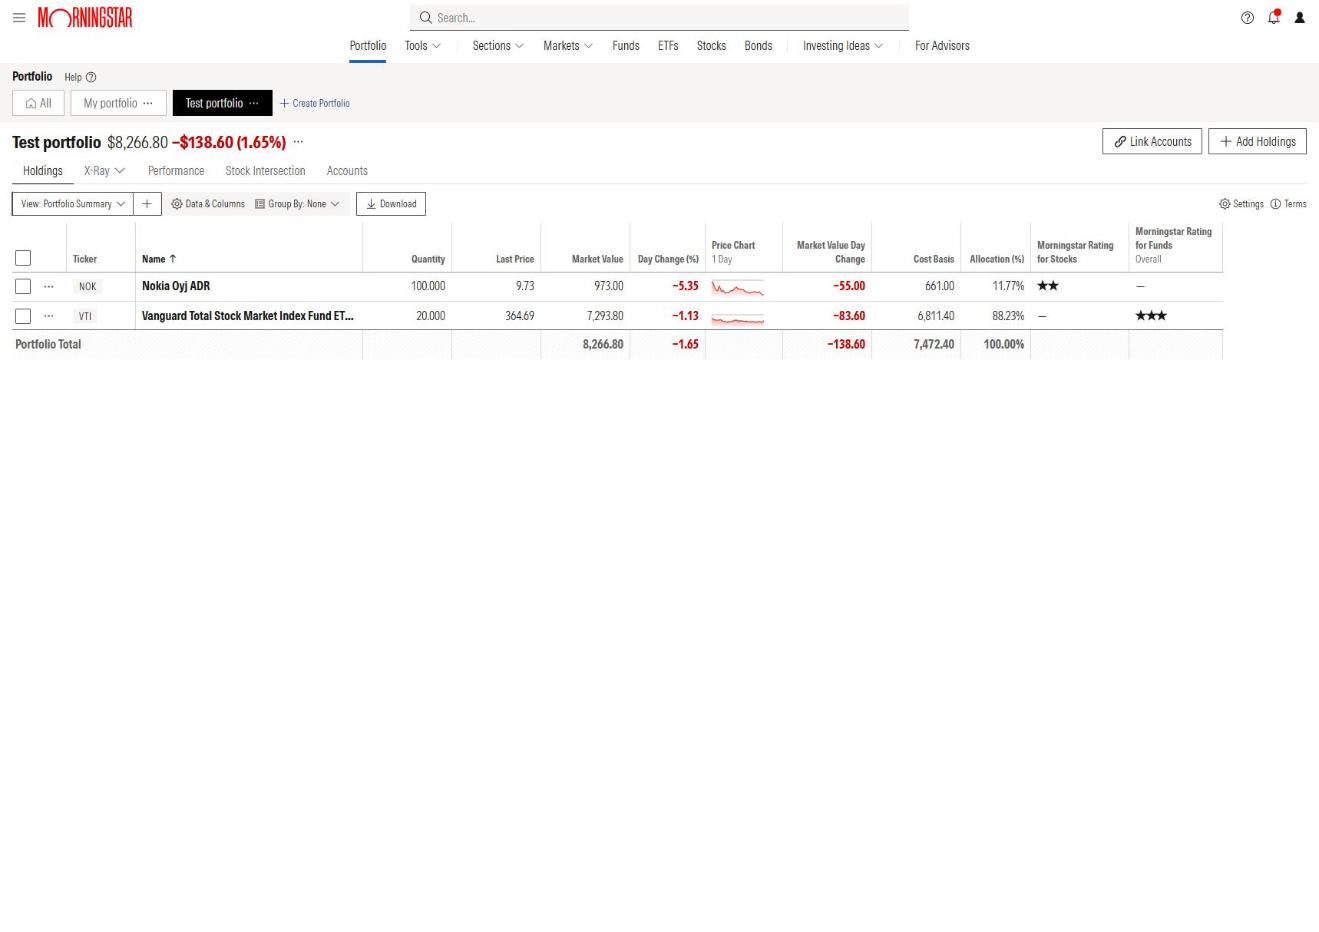
To see what X-Ray catches, I set up a simple test portfolio: 100 shares of Nokia (NOK) and 20 shares of Vanguard’s Total Stock Market ETF (VTI). Two holdings. You’d think there’s nothing to find.
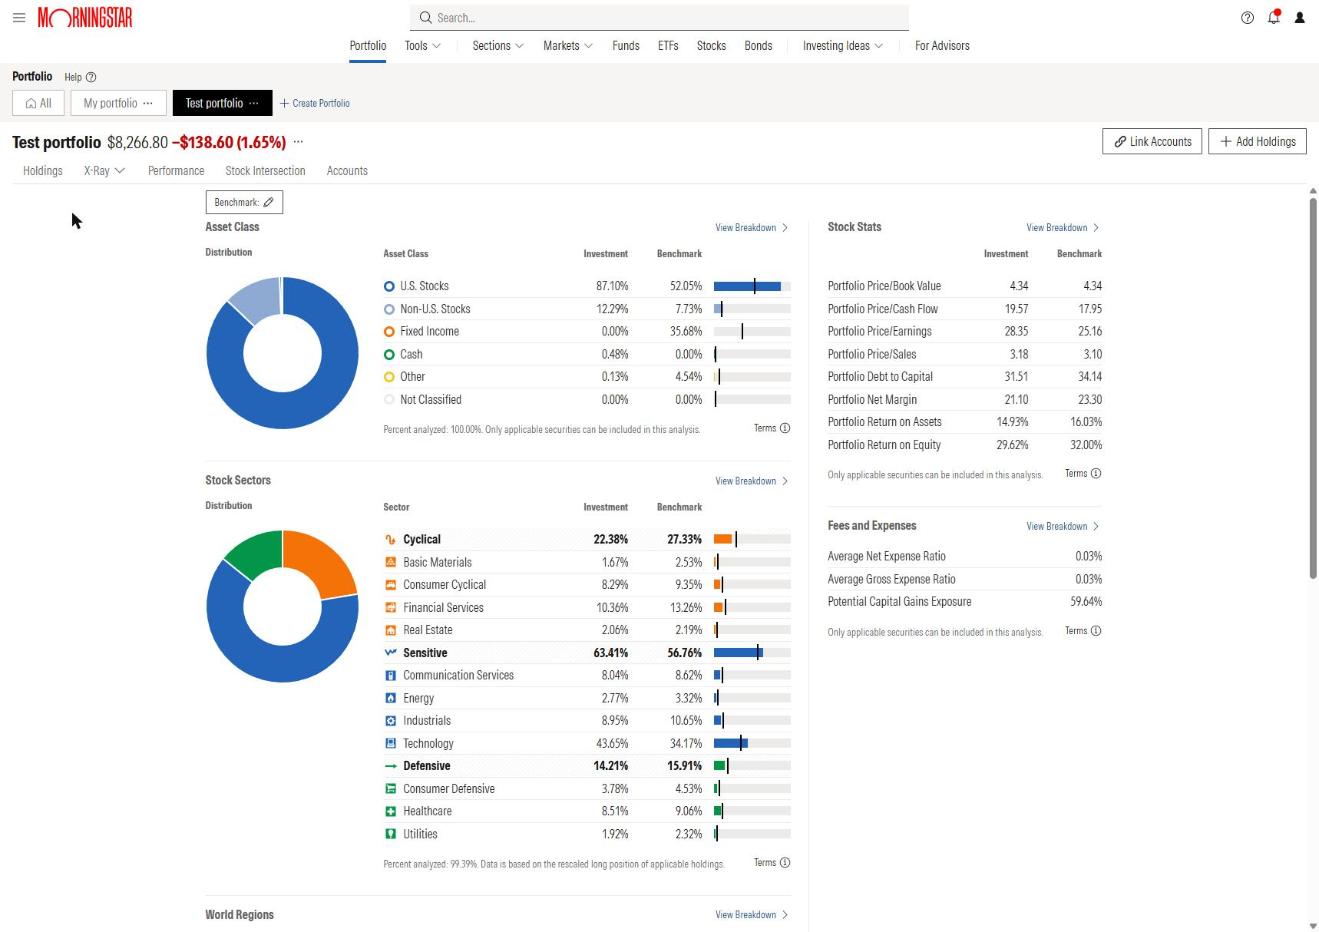
Here’s what X-Ray showed when I ran it in July 2026:
- 87.10% U.S. stocks against 52.05% for the benchmark I picked
- 0% bonds against 35.68% for the benchmark
- 43.65% in technology against 34.17% for the benchmark
- 0.03% average net expense ratio, so fees weren’t the problem
That’s a lot of tech for a portfolio with one broad index fund in it. The benchmark comparison is what makes it jump out.
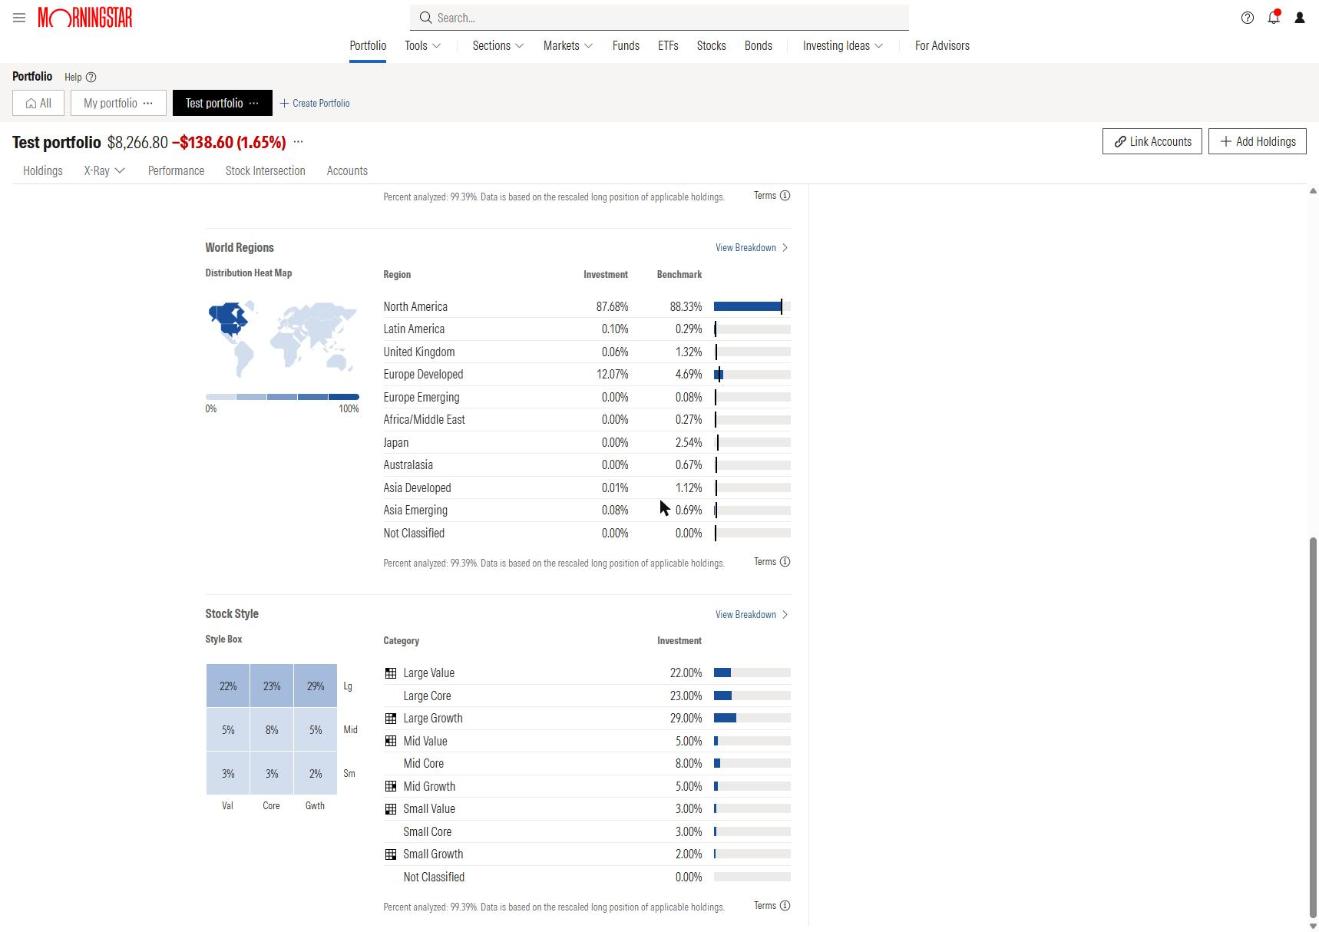
Scrolling down, World Regions put 12.07% of the portfolio in developed Europe against 4.69% for the benchmark. That’s almost all Nokia. The style box showed 74% in large companies (22% value, 23% core, 29% growth).
Stock Intersection: where the overlap shows up
X-Ray tells you you’re heavy in tech. Stock Intersection tells you which companies put you there. It lists the top 50 stocks in your portfolio and shows which of your holdings each one comes through.
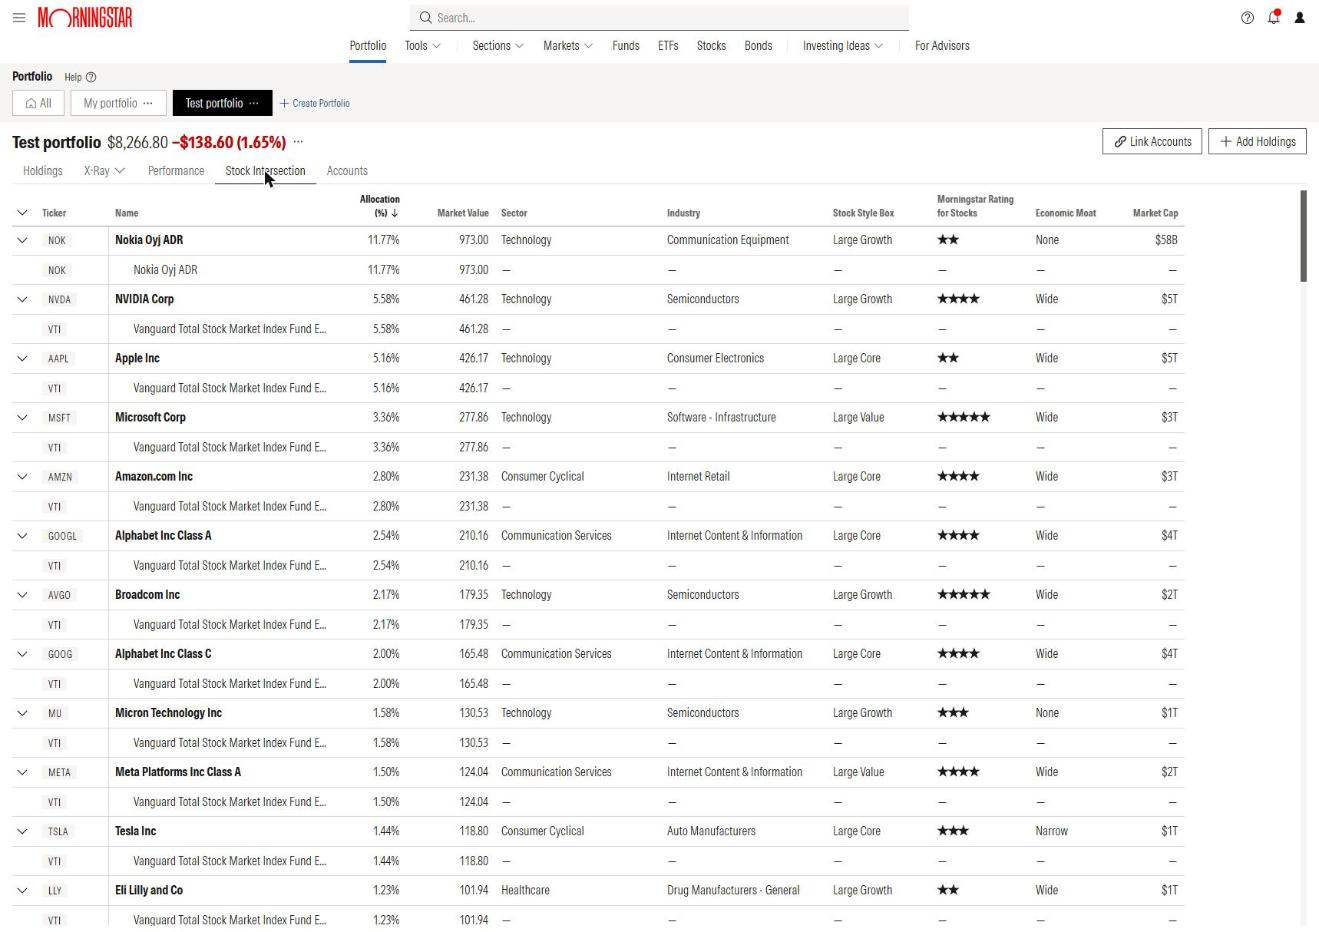
In my test portfolio, NVIDIA came out at 5.58%, Apple at 5.16% and Microsoft at 3.36%, all through VTI. I never bought any of them directly. Morningstar’s own help page gives a similar example: Microsoft at 3.98% of a portfolio through two funds, VFINX and QQQ. If you own a few funds, that’s the overlap to look for.
Run X-Ray on Your Own Portfolio: Start a 7-Day Free Trial
How to use Morningstar X-Ray, step by step
- Set up a portfolio. Link your brokerage accounts, or add holdings by hand. You can have up to 25 portfolios.
- Open X-Ray. In your portfolio, pick an X-Ray view from the drop-down: Asset Class, World Regions, Stock Style and so on.
- Choose a benchmark. Morningstar’s options run from aggressive (more stocks) to conservative (more bonds). Pick the one closest to what you’re aiming for.
- Read the charts. Look for the biggest gaps between your column and the benchmark’s.
- Click View Breakdown. It shows which holding is causing each gap.
- Check Stock Intersection. If one company shows up through several funds, that’s your concentration.
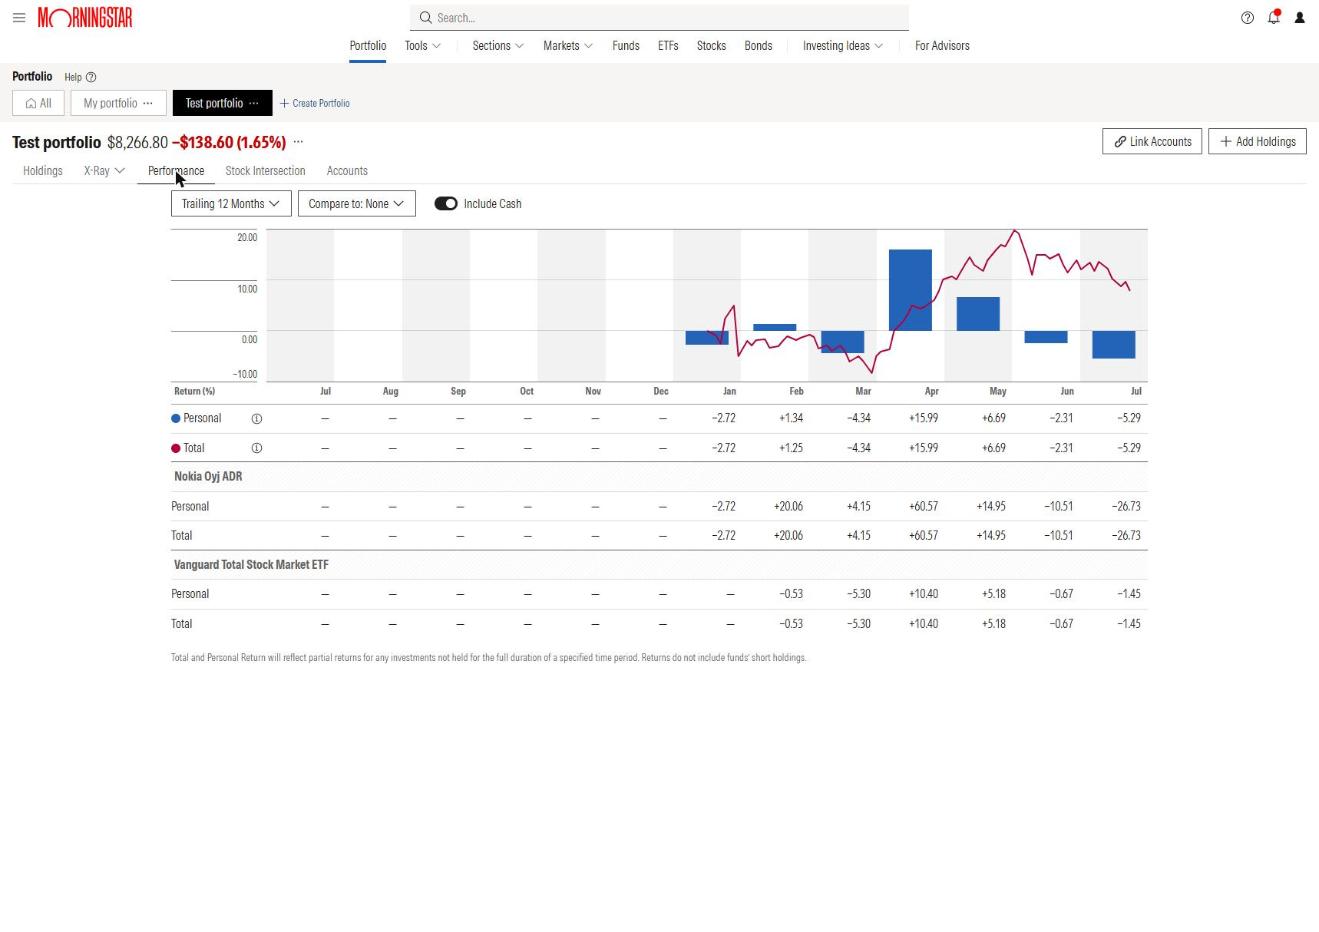
The Performance tab sits next to X-Ray. It charts your portfolio’s return over time, and you can add an index to compare against.
Is Morningstar X-Ray free?
No. X-Ray is part of Morningstar Investor, and Morningstar’s help center states there’s no free tier for Investor. If you cancel, you lose the portfolio tools too.
If you remember a free version, that was the old setup. Morningstar Premium was converted to Morningstar Investor in June 2022 and can’t be bought anymore. The legacy Portfolio Manager is still there only for former Premium members who keep an Investor subscription.
Morningstar Investor pricing (as of October 26, 2026)
- 7-day free trial, one per person
- $249 a year, or $34.95 a month
- $199 for the first year of a yearly plan through a partner link like ours ($50 off)
- The $50 discount is for the first year only and can’t be combined with other offers
Start your 7-day free trial and run X-Ray on your own holdings.
Who Morningstar X-Ray is for
Pros
- Looks inside every fund and ETF you own and adds it up
- Compares your mix to a benchmark you choose
- View Breakdown shows which holding causes each gap
- Stock Intersection names the companies you own several times over
- Works with linked accounts or holdings you enter by hand
Cons
- No free version: it needs a Morningstar Investor subscription
- Most useful with several funds; a single-stock portfolio won’t show much
- The benchmark you pick changes every comparison, so choose it with care
If you own more than one fund, X-Ray will show you something you didn’t know about your own portfolio. Try it free for 7 days and run it on what you actually hold.
Get $50 Off Your First Year of Morningstar Investor: $199 Instead of $249
No. X-Ray is part of Morningstar Investor, which has no free tier. There’s a 7-day free trial, then it’s $249 a year or $34.95 a month.
Your portfolio’s asset class mix, 12 stock sectors, world regions, fees and expenses, stock stats and style boxes, each compared to a benchmark you choose.
A table of the top 50 stocks in your portfolio that shows which of your funds each one comes through, so you can spot overlap and concentration.
Premium was converted to Morningstar Investor in June 2022. Legacy Portfolio Manager is only available to former Premium members who are current Investor subscribers.