It starts with Netflix.
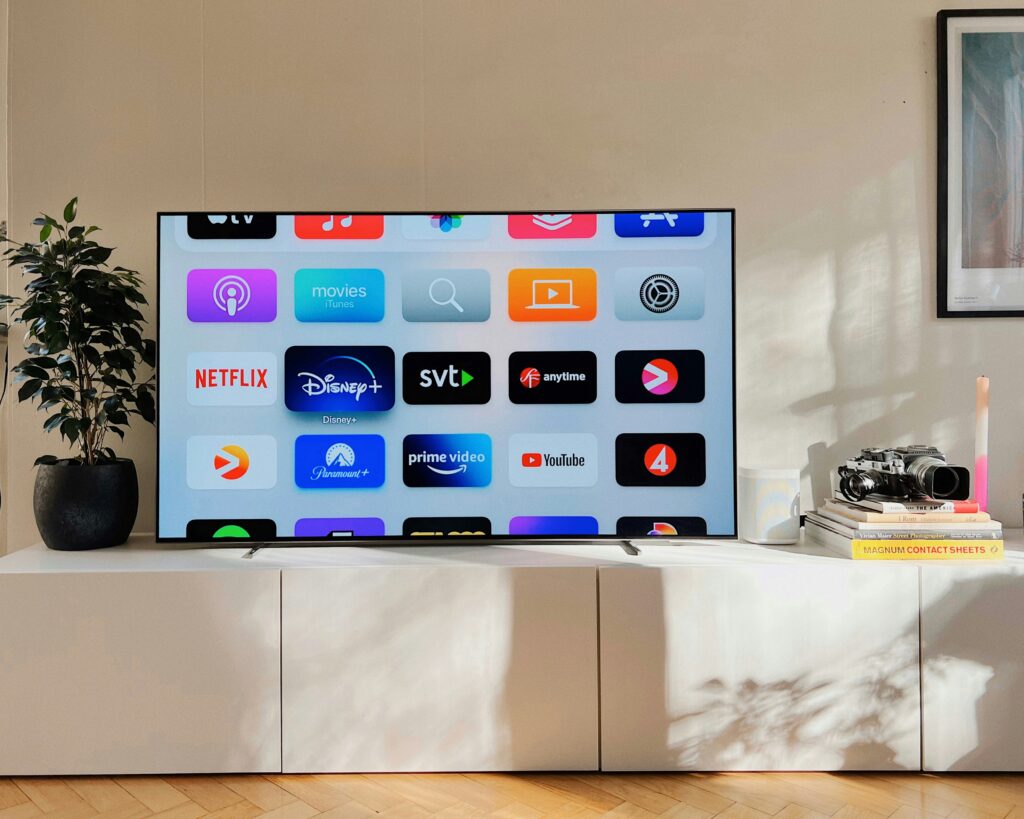
Then comes Spotify, because you can’t stand the ads. Then Disney+ for one show, Amazon Prime because you already use it for shipping, and Max because everyone’s talking about that new series. Throw in a Hulu plan, maybe Apple TV+ on a free trial you forgot to cancel, and suddenly you’re paying for 6 platforms — most of which you rotate through one at a time.
Nobody decides to spend $70 a month on streaming. It just happens, one $8.99 button click at a time.
And here’s the thing about small monthly charges: they’re specifically designed to feel insignificant. That’s the whole business model. But add them up, run them forward a few decades, and the number stops looking small very quickly.
How to Save Money on Streaming Services: First, Let’s Talk About What You’re Actually Spending
According to Deloitte’s 2025 Digital Media Trends report, the average American household now spends $69 per month on video streaming alone — and that’s before you add music, audiobooks, podcasts, or gaming subscriptions. If you’re wondering how to save money on streaming services, the fastest place to start is a subscription audit: cancel the services you rarely use, stop paying for content you don’t consume, and put that monthly savings toward goals or investments instead.
Reviews.org puts the broader streaming figure at $52 per month based on self-reported spending, while Deloitte’s independent research — which tracks actual billing data — puts it higher. For people and households juggling multiple streaming subscriptions and trying to cut monthly costs without giving up the content they actually watch, the problem usually isn’t one expensive platform — it’s the pileup, the price increases, and the unused subscriptions hiding in plain sight.
Here’s how a typical subscriber stack adds up in 2026:
| Service | Monthly Cost (ad-free) |
|---|---|
| Netflix Standard | $19.99 |
| Spotify Premium | $12.99 |
| Disney+ | $16.99 |
| Max | $16.99 |
| Amazon Prime Video | $8.99 |
| Apple TV+ | $9.99 |
| Hulu | $18.99 |
| Total | $104.93/month |
Most people don’t have all 7. But nearly 25% of US households spend over $100/month on streaming and subscription services, according to MediaPost. The average household subscribes to 4 services, per Deloitte — and nearly half (47%) of those subscribers say they pay too much.
The most revealing data point: 32% of respondents pay for at least one service they rarely use, according to Reviews.org. That’s not entertainment spending. That’s money quietly draining from your account every month for nothing. This guide breaks down subscription spending habits, how to audit your current services, ways to lower streaming costs, what repeated price hikes do to your budget, and the longer-term opportunity cost when unused subscriptions crowd out saving and investing — because even a small monthly leak can turn into meaningful lost wealth over time.
Step 1: The Subscription Audit Most People Never Do
Before the investing math, there’s a more immediate exercise worth doing to uncover unnecessary expenses.
Pull out your last 2 months of bank and credit card statements. Find every recurring charge; a subscription tracker can help catch them across accounts. Include the ones you forgot about — the $4.99 here, the $14.99 there, the annual plan that auto-renewed without a notification. Add them up.
Most people are surprised by the total. Research consistently shows that consumers underestimate their subscription spending by 40–80% when asked to recall it from memory.
Now split your list into two columns:
**Column A: Services you used meaningfully in the last 30 days.**Column B: Everything else.
Column B is the opportunity. You don’t have to cancel everything; you have to be honest about what you’re actually watching versus what you’re paying for out of habit.
For most households, canceling Column B frees up $20 to $40 a month without meaningfully changing how much content they consume. For heavier subscribers, it can be $50 to $80.
That freed-up money is what the rest of this article is about.
Step 2: The Opportunity Cost of Streaming Services — “Just $15 a Month”
Here’s where the math starts to bite.
Every dollar you spend on a subscription you don’t use isn’t just gone — it’s a dollar that didn’t compound. And over 10, 20, or 30 years, even small monthly amounts become significant.
Let’s use a 10% annual return, consistent with the stock market’s long-term historical average, and model what different monthly subscription amounts are actually worth over time if invested instead:
| Monthly Amount Invested | 10 Years | 20 Years | 30 Years | Sustainable Annual Withdrawal (4% rule) at 30 Years |
|---|---|---|---|---|
| $20/month | ~$41,000 | ~$153,000 | ~$452,000 | ~$18,080/year |
| $50/month | ~$103,000 | ~$382,000 | ~$1,130,000 | ~$45,200/year |
| $100/month | ~$206,000 | ~$765,000 | ~$2,260,000 | ~$90,400/year |
| $150/month | ~$309,000 | ~$1,148,000 | ~$3,390,000 | ~$135,600/year |
That $15.99 Disney+ subscription you keep but rarely open? Over 30 years, invested instead, it has become roughly $32,000. Not life-changing on its own — but that’s one subscription. Stack five unused or barely-used services at an average of $15 each, and you’re looking at a combined $160,000 that quietly disappeared into a content library you barely touched.
Step 3: The Real Numbers for Real Subscribers
Let’s run three realistic subscriber profiles and show exactly what the streaming habit is actually costing in long-term wealth.
Profile 1: The Casual Subscriber — $50/month Netflix and Spotify. Nothing fancy. Consistent, habitual, barely noticed.
- Annual streaming cost: $600
- Over 20 years invested at 10%: $382,000
- Over 30 years invested at 10%: $1,130,000
Profile 2: The Average Household — $69/month Video streaming across 4 platforms per Deloitte’s 2025 data. Reasonable by today’s standards.
- Annual streaming cost: $828
- Over 20 years invested at 10%: $527,000
- Over 30 years invested at 10%: $1,558,000
Profile 3: The Heavy Subscriber — $120/month Six or seven services including music, video, audiobooks, gaming. A common profile for households with kids or multiple users.
- Annual streaming cost: $1,440
- Over 20 years invested at 10%: $916,000
- Over 30 years invested at 10%: $2,712,000
None of these people are being reckless. They’re just streaming. But the opportunity cost, compounded over decades, ranges from $382,000 to over $2.7 million depending on how deep the habit runs.
Step 4: The “Cut Half, Invest Half” Strategy for Investment Contributions
You don’t have to cancel everything. That’s not realistic and it’s not the point.
The smarter move is what we’ll call the Cut Half, Invest Half approach: audit your subscriptions, cancel the ones you’re not actively using, and redirect exactly that amount — whatever it is — into a recurring investment.
Here’s how it typically plays out:
Most households, when they do an honest audit, find 2–3 services they’re paying for out of inertia rather than active enjoyment. At an average of $15–$18 per service, that’s $30–$54 a month sitting in Column B.
Cancel those. Automate a monthly transfer of the same amount into an index fund. You haven’t changed your actual viewing habits at all — you’ve just stopped paying for content you weren’t watching anyway.
That $40/month redirect, invested at 10% annually:
| Timeline | Value |
|---|---|
| 10 years | ~$82,000 |
| 20 years | ~$306,000 |
| 30 years | ~$905,000 |
Nearly a million dollars — from canceling two streaming services you weren’t really using.
Step 5: What Price Hikes Are Actually Costing You
Here’s something most subscribers don’t account for: streaming prices aren’t stable. They’re rising consistently, and the compounding effect of those increases quietly accelerates the opportunity cost.
Since 2020, major platforms have raised prices significantly:
- Netflix Standard plan: $13.99 (2020) → $19.99 (2026) — a 43% increase in six years
- Disney+: $6.99 (launch) → $16.99 (2026) — a 143% increase
- Hulu (ad-free): $11.99 (2020) → $18.99 (2026) — a 58% increase
- Max: $14.99 (as HBO Max, 2020) → $16.99 (2026)
And the hikes show no sign of stopping. Just in early 2026, Netflix raised prices across all tiers again, Peacock jumped from $7.99 to $10.99, and Paramount+ quietly added $1 to both its plans. One tracker found that six common subscriptions now cost a combined $132 more per year than they did at the start of 2026 alone.
Every price hike that goes unnoticed is a silent increase in your monthly bill and, consequently, in the opportunity cost of not investing that money instead. The habit that costs $70–$100/month today will cost meaningfully more within five years — without you subscribing to a single new service.
Step 6: The Broader Lesson — Subscriptions, Lifestyle Inflation, and Financial Security
There’s a reason the subscription economy has grown so aggressively: it works. Small recurring charges fly under the radar of normal budgeting because they never feel like a decision. They’re automatic, invisible, and individually harmless-seeming.
That’s the same mechanism behind all lifestyle inflation — the slow, frictionless expansion of spending that keeps pace with (or outpaces) income. Most people don’t decide to spend more every year. It just happens through accumulated small commitments that each seemed perfectly reasonable at the time.
The antidote isn’t extreme frugality. It’s visibility and intention. Free, ad-supported options can cover some viewing time, so you don’t feel pressure to keep every paid subscription active. Sharing family plans can lower costs if you follow platform rules.
The goal isn’t to carry every service year-round just for one kind of content. Apple TV+ is a good example of a service to dip into for originals like Ted Lasso and Severance, though if you’re already paying for Apple TV+ and other Apple services, Apple One can be a better value because it bundles Apple Music and, in some tiers, Apple Arcade. Disney+ can be worth a short-term subscription if you want Marvel titles and all Star Wars movies, though Disney bundles can save money if your household also wants Hulu or sports. Hulu may make sense when you want current programming from ABC, CBS, and NBC, while live TV is a separate pricier option if you actually need channels rather than just on-demand shows. Amazon Prime Video is another case, especially if you’re subscribing for its 66 NBA games this season, and unlike other services it may be worth keeping only if you use the broader subscription benefits.
When you know that $69 a month in streaming costs could be $1.5 million over 30 years, you don’t necessarily cancel Netflix. But you probably do cancel the two services you opened for one show and never closed. And you start treating that money as something with a future value, not just a present one.
That shift in perspective is what separates people who build wealth from people who wonder where it went.
Nobody feels like they’re making a financial mistake when they subscribe to a streaming service. The charge is small, the content is real, and the convenience is genuine.
But convenience has a compounding price. The average household is paying $69/month for video streaming alone — nearly $830 a year — and prices are rising every year with no signs of stopping. Nearly a third of subscribers are paying for at least one service they rarely open.
Audit your subscriptions. Cancel the ones living in Column B. Automate the savings into an index fund. Then leave it alone.
The shows will still be there, and a free service can fill the gap while you rotate paid subscriptions. The money, if you don’t redirect it, won’t be.
New to investing? Wall Street Survivor gives you $100,000 in virtual money to practice in our real-time stock market simulator — risk-free. Plus, our free courses will teach you everything you need to get started the right way. Get started here!
Rank of Top Stock Newsletters Last 3 Years, as of June 27, 2026
We are paid subscribers to dozens of stock and option newsletters. We actively track every recommendation from all of these services, calculate performance, and share our results of the top performing stock newsletters whose subscriptions fees are under $500. The main metric to look for is "Return vs S&P500" which is their return above that of the S&P500. So, based on June 27, 2026 prices:
Best Stock Newsletters Last 3 Years' Performance
| Rank | Stock Newsletter | Picks Return | Return vs S&P500 | Picks w Profit | Max % Return | Current Promotion |
|---|---|---|---|---|---|---|
| 1. |  Alpha Picks | +108% | +85% | 72% | 1,571% | September, 2026 Promotion: See all their picks & get $124 off |
| Summary: 2 picks per month based on Seeking Alpha's Quant Rating; consistently beating the market every year since launch; tells you when to sell and they have sold almost half. See complete details in our Alpha Picks Review. Or get their Premium service to get their QUANT RATINGS on your stocks to better manage your current portfolio--read our Is Seeking Alpha Worth It? article to learn more about their Quant Ratings. | ||||||
| 2. |  Zacks Value Investor | +36% | +22% | 44% | 441% | September, 2026 Promotion: $1, then $495/yr |
| Summary: 10 stock picks per year on January 1st based on Zacks' Quant Rating; Retail Price is $495/yr and includes 6 different services including those below. Read our Zacks Review. | ||||||
| 3. | Zacks Top 10 | +36% | +22% | 77% | 170% | September, 2026 Promotion: $1, then $495/yr |
| Summary: 10 stock picks per year on January 1st based on Zacks' Quant Rating; Retail Price is $495/yr and includes 6 different services. Read our Zacks Review. | ||||||
| 4. |  Action Alerts Plus | +31% | +12% | 64% | 449% | Current Promotion: None |
| Summary: 100-150 trades per year, lots of buying and selling and short-term trades. Read our Jim Cramer Review. | ||||||
| 5. |  Moby.co | +39% | 10% | 62% | 1,566% | September, 2026 Promotion: Get #1 Stock Pick Free |
| Summary: All it requires is an email address to get their #1 stock pick free; 60+ stock picks per year, segmented by industry; consistently beating the market every year; retail price is $365/yr but save try it for $99. Read our Moby Review. | ||||||
| 6. |  TipRanks SmartInvestor | +19% | +8% | 57% | 361% | Current Promotion: Save $180 |
| Summary: About 1 pick/week focusing on short term trades; Lifetime average return of 355% vs S&P500's 149% since 2015. Retail Price is $379/yr. Read our TipRanks Review. | ||||||
| 7. | Zacks Home Run Investor | +10% | +5% | 42% | 427% | September, 2026 Promotion: $1, then $495/yr |
| Summary: 40-50 stock picks per year based on Zacks' Quant Rating; Retail Price is $495/yr. Read our Zacks Review. | ||||||
| 8. | IBD Leaderboard ETF | 11% | -1.8% | n/a | n/a | September, 2026 Promotion: NONE |
| Summary: Maintains top 50 stocks to invest in based on IBD algorithm; Retail Price is $495/yr. Read our Investors Business Daily Review. | ||||||
| 9. | Zacks Under $10 | +1% | -2% | 35% | 263% | September, 2026 Promotion: $1, then $495/yr |
| Summary: 40-50 stock picks per year based on Zacks' Quant Rating; Retail Price is $495/yr. Read our Zacks Review. | ||||||
| 10. | Dogs of the Dow Strategy | +6% | --7% | 50% | 34% | Current Promotion: None |
| Summary: Buy the 10 highest yielding dividends stocks in the Dow Jones Industrial Average on January 1st and sell on Dec 31st each year. | ||||||
| 11. |  Stock Advisor | +7% | -17% | 59% | 141% | September, 2026 Promotion: Get $100 Off |
| Summary: 2 picks/month and 2 Best Buy Stocks lists focusing on high growth potential stocks over 5 years; Retail Price is $199/yr. Read our Motley Fool Review. | ||||||
| 12. | Rule Breakers | +11% | -18% | 51% | 208% | Current Promotion: Save $200 |
| Summary: Rule Breakers is included with the Fool's Epic Service. Get 5 picks/month focusing on disruptive technology and business models; Lifetime average return of 355% vs S&P500's 149% since 2005; Now part of Motley Fool Epic. Read our Motley Fool Epic Review. | ||||||
| Top Ranking Stock Newsletters based on their last 3 years of stock picks covering 2026, 2025, 2024, and 2023 performance as compared to S&P500. S&P500's return is based on average return of S&P500 from date each stock pick is released. NOTE: To get these results you must buy equal dollar amounts of each pick on the date the stock pick is released. Investor Business Daily Top 50 based on performance of FFTY ETF. Performance as of April 5, 2026. | ||||||