VectorVest is a functional platform built around a proprietary algorithm that calculates and condenses information into three factors (Value, Safety, and Timing) that help you determine when to buy, sell, and hold different stocks and ETFs.
In this VectorVest review, we’ll be diving into the platform’s features, tools, and historical performance to help you determine if it’s the right service for you.
Let’s get started!
What is VectorVest?
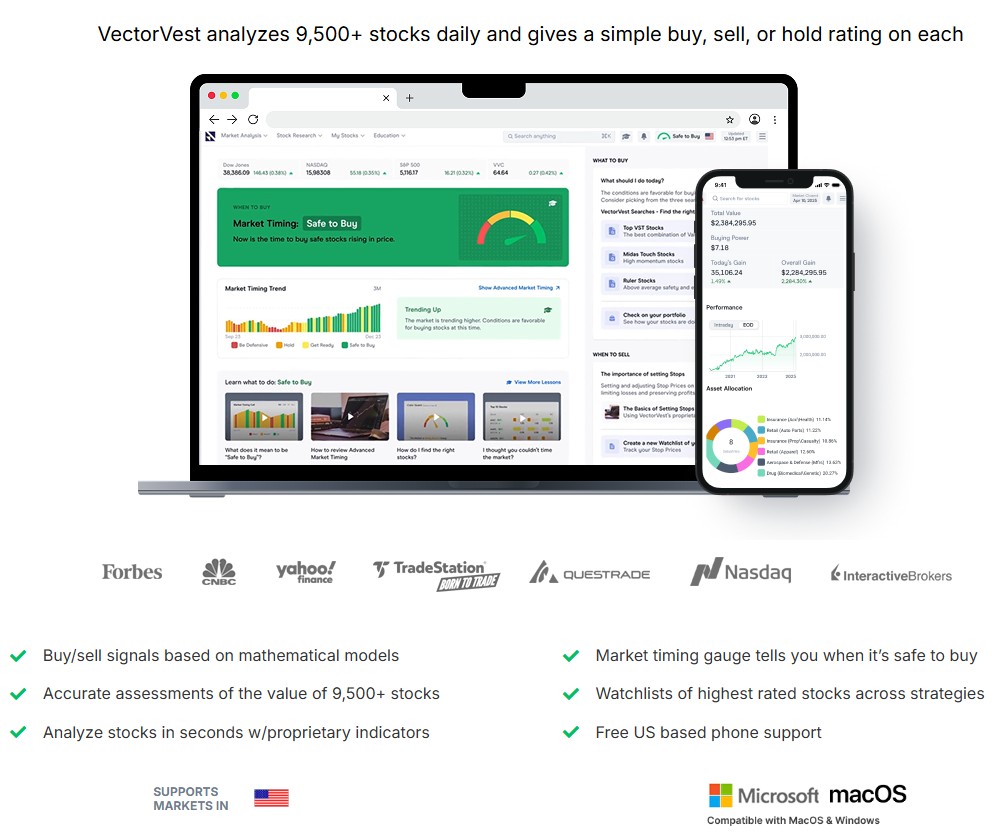
VectorVest is a downloadable investing platform packed with tools for researching, analyzing, and trading over 18,000 different stocks and ETFs. VectorVest itself is very functional with or without the optional add-ons they offer on the site, but the real draw is the underlying mathematical models and algorithms that drive VectorVest’s proprietary indicators and analysis.
It all starts with the company’s founder, Dr. Bart DiLiddo. Dr. DiLiddo is The Guy behind VectorVest. He’s a mathematician with a PhD from Case Western Reserve University, a graduate from the Sloan School of Management in MIT, and he “has a Fortune 500 business background,” according to the VectorVest site.
Dr. DiLiddo has spent over 30 years developing mathematically supported formulas and models to analyze the performance of individual stocks, measure their risk, and identify market tops and bottoms to help investors increase their returns, make fewer investing mistakes, and build stronger portfolios.
Pro Tip:
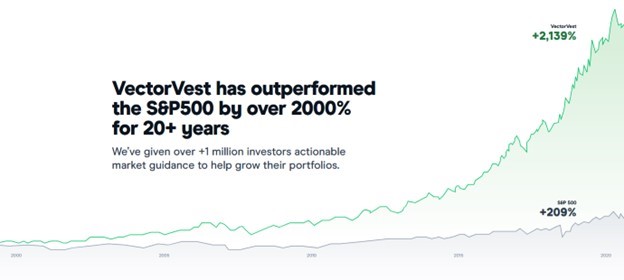
VectorVest is an advanced stock analysis and portfolio management platform that uses a refined mathematical model that provides unbiased recommendations based on stock market timing, stock value, and safety. Over the course of almost 22 years, one of VectorVest’s trading strategies beat the S&P 500 by upwards of 2,000%. Try out VectorVest for 30 days for only $9.95!
How does it work?
The mathematical basis for the models, formulas, and algorithms that VectorVest uses to generate its indicators and buy/sell/hold signals isn’t available to the public – which makes sense.
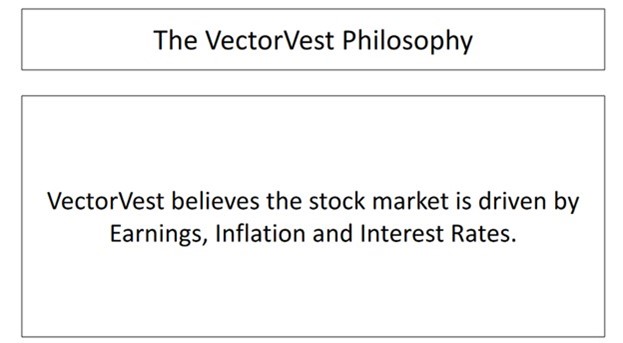
What we do know is Dr. DiLiddo’s investing philosophy:
- “VectorVest believes every investor should know
- What a stock is really worth
- How safe it is
- When to buy, sell, or hold”
And:
- “Vectorvest believes in buying safe, undervalued stocks rising in price in rising markets. We also believe in selling falling stocks in falling markets.”
It’s pretty groundbreaking stuff. Buy low while the markets rise; sell high before the markets fall.
Yes, it’s pretty fundamental stuff, but that’s kind of the point. The more I look at VectorVest and what it’s trying to do, the more I realize that it’s trying to use advanced mathematical models and statistical analysis to turn the principles of good old-fashioned fundamentals-based investing into practical, accurate investing advice. Sort of like building a nuclear reactor to power a bass boat.
All that complexity from the financial markets and the innumerable data points it creates are distilled down into just three main pillars: Value, Safety, and Timing (plus a few metrics derived from the same).
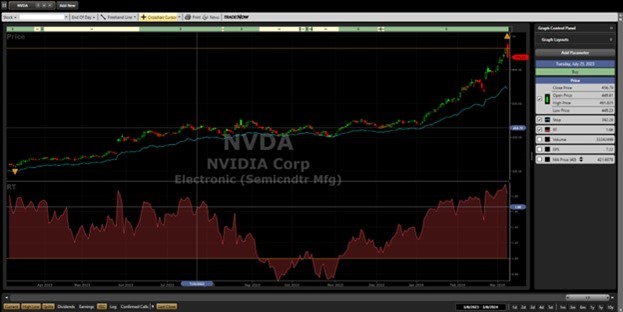
When you pull up a security on VectorVest, you’ll see most of what you’d see on other platforms: price, P/E, Earnings Per Share, Volume, and so on. But you’ll also see a few unfamiliar ones (the ones on the right): Value, RV, RS, RT, VST, CI, and REC. These are the VectorVest indicators I was talking about.
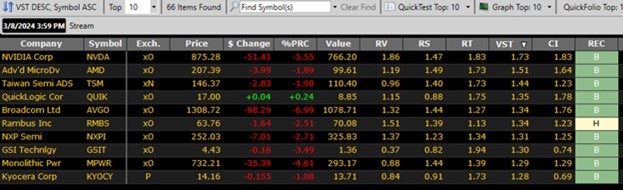
The indicators are fairly simple, but informative:
- Value: VectorVest’s estimate of the stock’s actual value based on forecasts of earnings per share, earnings growth, profitability, interest rates, and inflation.
- Relative Value (RV): Measures a stock’s long-term growth potential compared to an alternative investment in AAA corporate bonds. It’s measured on a scale of 0.00 to 2.00, where anything above 1.00 is considered favorable. It’s calculated with projections of price appreciation three years out, AAA corporate bond rates, and risk.
- Relative Safety (RS): A measure of the statistical probability of whether a stock will meet one’s price performance expectations, AKA how risky the stock is. It’s calculated based on an analysis of the consistency and predictability of a company’s financial performance, debt-to-equity ratio, sales volume, business longevity, price volatility, and other factors.
- Relative Timing (RT): Analyzes a stock’s price trend based on an analysis of the direction, magnitude, and dynamics of a stock’s price movements.
- Value-Safety-Timing (VST): The so-called “master indicator” for ranking stocks in the VectorVest database. It’s equal to the square root of a weighted sum of the squares of RV, RS, and RT. Stocks with higher VST ratings have the best combinations of Value, Safety, and Timing.
- Comfort Index (CI): Reflects a stock’s ability to resist severe and/or lengthy price declines. Based on a stock’s long-term price history.
- Recommendation (REC): A recommendation to buy, sell, or hold a stock based on the cumulative effect of all the VectorVest indicators rolled together.
Pretty straightforward, right? As promised, VectorVest has crunched the numbers for you to bring you easy-to-understand metrics and indicators that can help you make big decisions based off a few little numbers. No need for manual analysis or research or pretty much anything. All you need to do is pay attention to what VectorVest is telling you and bam! Money. If it works, that is.
That’s the big question here: VectorVest gives you a ton of answers at a glance, but are they the right answers?
Can VectorVest Help You Make More Money?
VectorVest has a few unique ways to help you make better investing decisions and make more money using its proprietary metrics and signals. Here are just a few examples:
The first is pretty obvious: Use the VST indicators to find stocks that are undervalued. Buy them, wait, then sell them at a higher price.
Second: Find stocks with the highest VST ratings. Buy them, wait, then sell them when VectorVest’s rating changes to Sell.
Third: Find stocks rated as Buy. Hold them while they’re rated as “Hold,” then sell them when their rating changes to “Sell.” Simple.
You get the picture. VectorVest lays out one potential path on its website:
- Check for stocks rated a sell.
- Check the market timing signal to see if you should buy stocks or tighten stops on existing positions.
- If the market timing is favorable, pick stocks with the highest VST rating.
- Set recommended stop prices, calculated uniquely for each stock based on its historical price movement.
In other words, VectorVest’s proprietary metrics combined with its suite of research and stock-picking features are very potent tools for almost any investor. It sounds great in theory. The question is, does it work in practice?
VectorVest Performance
It’s hard to say if VectorVest’s indicators are useful or if its buy/sell/hold signals are accurate. You’d need to use VectorVest and follow all of its recommendations exactly when they make them for at least a year, then compare your results against the major indices to even get a partial answer.
The good news is that VectorVest says it’s been comparing its performance against the S&P 500 for over 20 years. They even say they make their numbers available so you can easily fact-check them.
And that’s good for us, because we at Wall Street Survivor love to fact-check.
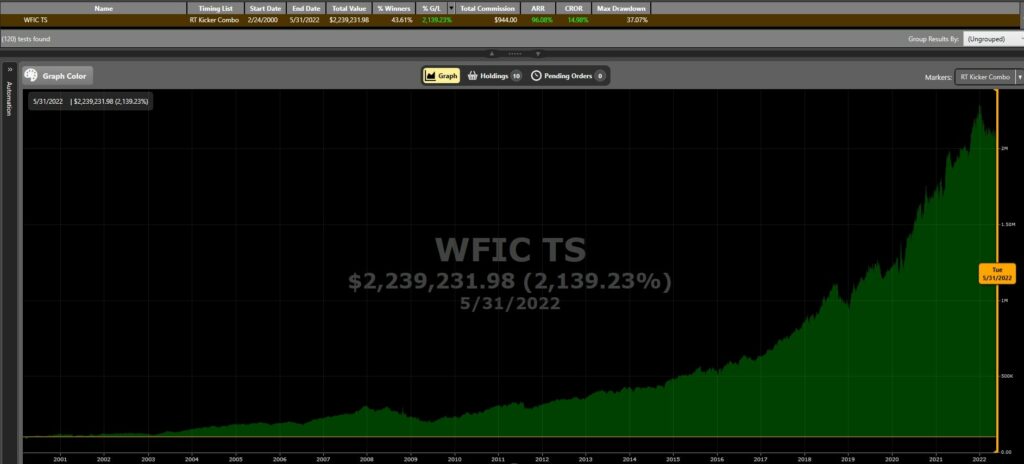
It’s difficult to evaluate the performance of VectorVest as a whole, since there are plenty of different combinations of tools and strategies you can use, as well as different types of recommendations that VectorVest provides. But what we can do is look at a model portfolio to see how an investor following a certain set of rules while following VectorVest’s trade ideas would have performed over a given time period. Here is the performance of a model portfolio that falls into their “Prudent” category and follows the “RT Kicker Combo” market timing strategy:
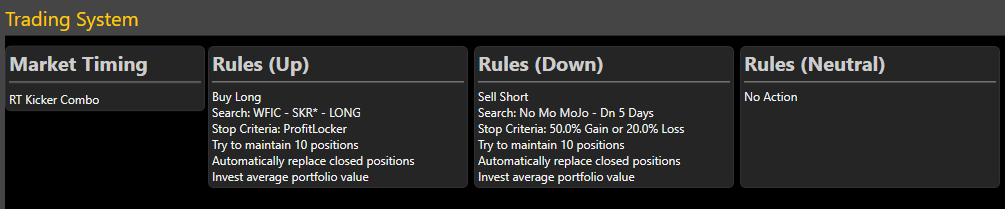
And here are the trading rules of this model portfolio:
As you can see, an investor following those rules would have gained 2,139% from February of 2000 to May of 2022. Now, let’s compare the model portfolio’s performance to that of the S&P 500:
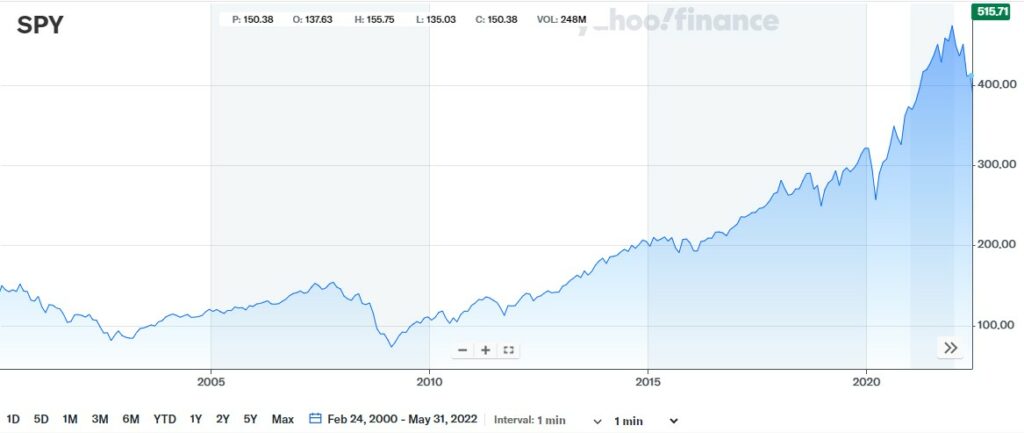
This is SPY, an ETF that tracks the performance of the S&P 500. (And a useful ticker symbol to keep in mind when performing market research!) Its closing price on February 24, 2000 was $133.81, and the closing price on May 27, 2022 was $415.26. This makes for a gain of 210%.
So, after comparing the performance of the VectorVest model portfolio and the S&P 500, we can say yes, VectorVest has beaten the S&P 500. But, there’s a catch: Not every stock trading strategy are equal. It’s possible that some of VectorVest’s other trade ideas and strategies didn’t perform quite as well, so keep that in mind. Be wise about your trading rules and remember that returns are never guaranteed.
To compare VectorVest’s performance against that of another successful service, read our Motley Fool review.
Why Use VectorVest?
VectorVest is a pretty robust platform with some very helpful features. Its stock screener comes with a ton of built-in searches to help you find stocks and ETFs that fit some very specific criteria. Its charting tools don’t come with as many of the fancy technical analysis tools as some of the other platforms, but it has more than enough for the majority of investors. It can be used for trading styles like technical analysis, intraday trading, and swing trading. Its proprietary metrics, signals, targets, and stop-loss features may not be infallible, but all of them provide useful information and suggestions that can point you in the right direction and help you feel more confident about your trades.
Pro Tip:
VectorVest is an advanced stock analysis and portfolio management platform that uses a refined mathematical model that provides unbiased recommendations based on stock market timing, stock value, and safety. Over the course of almost 22 years, one of VectorVest’s trading strategies beat the S&P 500 by upwards of 2,000%. Try out VectorVest for 30 days for only $9.95!
VectorVest Price
VectorVest offers several different account tiers, all of which come with a 30-day trial for $9.95.
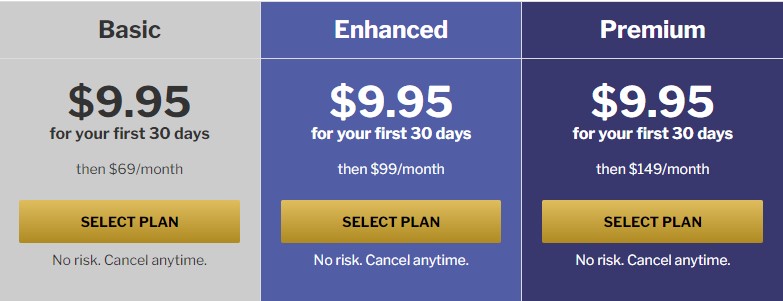
The Basic plan is $69 per month and offers the following features:
- Data updates (end of day)
- Stock analysis and ratings
- Daily stock picks
- Market timing
- Screeners and watchlists
- Trading plans
- Successful Investing Quick Start course
- Free education courses
- TradeNow (brokerage connection)
- Worldwide market analysis
- Phone support
The Enhanced plan costs $99 a month and comes with everything in the Basic plan, plus the following:
- Data updates (15-minute delay)
- Advanced Trading Stop (proprietary dynamic stop order)
The Premium plan goes for $149 every month. You’ll get everything that comes with the Enhanced plan, plus:
- Data updates (real-time)
- Successful Investing coaching group
- ProTrader (pre-built searches to find breakouts easily using technical indicators)
- AutoTimer (automated trading)
- WatchDog (advanced trade alerts)
You can also buy individual add-on services that range from advanced stock market data to options trading to automation tools for anywhere from $100 to $250 per month.
Is VectorVest Worth It?
You can probably use VectorVest to make more than enough money to cover its Basic membership package. That may not be the case for its Enhanced or Premium membership packages, depending on the size of your portfolio. You’ll also want to try the add-ons before you commit to spending ~$3,000 per year on each one. It’s always better to be safe than sorry, even if the add-ons turn out to be worth it in the end.
VectorVest Pros and Cons
Here’s what we like and don’t like about VectorVest.
Pros:
- Proprietary indicators (Value, Safety, Timing, and their derivatives) condense volumes of data and analytics into a few figures.
- Buy/sell/hold signals help you time your trades by giving you consistent suggestions of when to buy, sell, or hold.
- Does a lot of analysis automatically so you don’t have to.
- Helps eliminate emotions from trading decisions.
- Fairly robust set of screeners, strong search function, pretty decent charts and graphs.
Cons:
- Expensive, especially with add-ons.
- Platform runs locally and depends on your computer’s processing power.
- Methodology for calculating proprietary indicators and buy/sell/hold signals is unclear.
- The amount of information can be a bit overwhelming at first.
- Not much in terms of newsfeeds, social media integration, or community features.
- Tutorials and learning modules are practically required to figure out how to use the platform.
- Charting tools are relatively limited.
Pro Tip:
VectorVest is an advanced stock analysis and portfolio management platform that uses a refined mathematical model that provides unbiased recommendations based on stock market timing, stock value, and safety. Over the course of almost 22 years, one of VectorVest’s trading strategies beat the S&P 500 by upwards of 2,000%. Try out VectorVest for 30 days for only $9.95!
Final Thoughts
VectorVest is a powerful tool with a lot of features, many of which are built on or around its proprietary metrics. And it’s not like following VectorVest’s trade ideas is going to make you go broke in a couple weeks. They can be very useful in the right contexts. Just don’t take them as gospel or a guarantee that you’re going to see quadruple-digit returns if you follow them.
It also makes some claims about its performance that may not hold up across all its strategies, which can be off-putting for some investors.
Use VectorVest if you have a portfolio big enough to pay for a membership with its annual gains. Use it if you look at its list of features and think that any or all of them seem like they’d help you be a better trader. It’s a good platform. It’s worth checking out.
What do you think about the platform after reading our VectorVest review? Let us know in the comments!
Rank of Top Stock Newsletters Last 3 Years, as of May 31, 2026
We are paid subscribers to dozens of stock and option newsletters. We actively track every recommendation from all of these services, calculate performance, and share our results of the top performing stock newsletters whose subscriptions fees are under $500. The main metric to look for is "Return vs S&P500" which is their return above that of the S&P500. So, based on May 31, 2026 prices:
Best Stock Newsletters Last 3 Years' Performance
| Rank | Stock Newsletter | Picks Return | Return vs S&P500 | Picks w Profit | Max % Return | Current Promotion |
|---|---|---|---|---|---|---|
| 1. | Alpha Picks | +110% | +83% | 76% | 1,571% | June, 2026 Promotion: See all their picks & get $124 off |
| Summary: 2 picks per month based on Seeking Alpha's Quant Rating; consistently beating the market every year since launch; tells you when to sell and they have sold almost half. See complete details in our Alpha Picks Review. Or get their Premium service to get their QUANT RATINGS on your stocks to better manage your current portfolio--read our Is Seeking Alpha Worth It? article to learn more about their Quant Ratings. | ||||||
| 2. |  Zacks Value Investor | +58% | +46% | 53% | 1,134% | June, 2026 Promotion: $1, then $495/yr |
| Summary: 10 stock picks per year on January 1st based on Zacks' Quant Rating; Retail Price is $495/yr and includes 6 different services including those below. Read our Zacks Review. | ||||||
| 3. | Zacks Top 10 | +31% | +19% | 74% | 170% | June, 2026 Promotion: $1, then $495/yr |
| Summary: 10 stock picks per year on January 1st based on Zacks' Quant Rating; Retail Price is $495/yr and includes 6 different services. Read our Zacks Review. | ||||||
| 4. |  Action Alerts Plus | +20% | +6% | 61% | 208% | Current Promotion: None |
| Summary: 100-150 trades per year, lots of buying and selling and short-term trades. Read our Jim Cramer Review. | ||||||
| 5. |  TipRanks SmartInvestor | +13% | +5% | 57% | 266% | Current Promotion: Save $180 |
| Summary: About 1 pick/week focusing on short term trades; Lifetime average return of 355% vs S&P500's 149% since 2015. Retail Price is $379/yr. Read our TipRanks Review. | ||||||
| 6. | Zacks Home Run Investor | +7% | +2% | 43% | 337% | June, 2026 Promotion: $1, then $495/yr |
| Summary: 40-50 stock picks per year based on Zacks' Quant Rating; Retail Price is $495/yr. Read our Zacks Review. | ||||||
| 7. |  Moby.co | +19% | 0% | 55% | 797% | June, 2026 Promotion: Get #1 Stock Pick Free |
| Summary: All it requires is an email address to get their #1 stock pick free; 60+ stock picks per year, segmented by industry; consistently beating the market every year; retail price is $365/yr but save try it for $99. Read our Moby Review. | ||||||
| 8. | IBD Leaderboard ETF | 11% | -1.8% | n/a | n/a | June, 2026 Promotion: NONE |
| Summary: Maintains top 50 stocks to invest in based on IBD algorithm; Retail Price is $495/yr. Read our Investors Business Daily Review. | ||||||
| 9. | Zacks Under $10 | +0.4% | -3% | 33% | 263% | June, 2026 Promotion: $1, then $495/yr |
| Summary: 40-50 stock picks per year based on Zacks' Quant Rating; Retail Price is $495/yr. Read our Zacks Review. | ||||||
| 10. | Dogs of the Dow Strategy | +6% | --7% | 50% | 34% | Current Promotion: None |
| Summary: Buy the 10 highest yielding dividends stocks in the Dow Jones Industrial Average on January 1st and sell on Dec 31st each year. | ||||||
| 11. | Stock Advisor | +7% | -17% | 59% | 141% | June, 2026 Promotion: Get $100 Off |
| Summary: 2 picks/month and 2 Best Buy Stocks lists focusing on high growth potential stocks over 5 years; Retail Price is $199/yr. Read our Motley Fool Review. | ||||||
| 12. | Rule Breakers | +11% | -18% | 51% | 208% | Current Promotion: Save $200 |
| Summary: Rule Breakers is included with the Fool's Epic Service. Get 5 picks/month focusing on disruptive technology and business models; Lifetime average return of 355% vs S&P500's 149% since 2005; Now part of Motley Fool Epic. Read our Motley Fool Epic Review. | ||||||
| Top Ranking Stock Newsletters based on their last 3 years of stock picks covering 2026, 2025, 2024, and 2023 performance as compared to S&P500. S&P500's return is based on average return of S&P500 from date each stock pick is released. NOTE: To get these results you must buy equal dollar amounts of each pick on the date the stock pick is released. Investor Business Daily Top 50 based on performance of FFTY ETF. Performance as of April 5, 2026. | ||||||