Analyst price targets are Wall Street’s guesses at where a stock will trade in 12 months. Every big bank and research firm publishes them, and sites like TipRanks gather them up so you can see them side by side.
They’re useful if you know what to look at. A single target tells you very little. The spread between targets, which way they’re moving and who set them tell you a lot more. The SEC’s guide to analyzing analyst recommendations makes the same point: ratings don’t mean the same thing at every firm, so read the details.
I use a TipRanks Premium account for this. In this article, I’ll walk you through how I read the targets on one stock, Apple, and what to check before you trust any of them.

Try TipRanks Premium 50% offf; 30 day money back guarantee — full access to analyst ratings, Smart Scores, insider data, and more.
- Analyst ratings ranked by historical accuracy & average return — not just consensus
- Smart Score: data-driven 1–10 composite ranking combining 8 key signals
- Insider trading & hedge fund activity tracker updated in real time
- AI-powered news sentiment analysis on stocks, ETFs & crypto
- Free plan available; Premium adds full analyst data, screeners & alerts
See Which Analysts Actually Get Their Targets Right With TipRanks Premium
What is an analyst price target?
A price target is the price an analyst thinks a stock will reach, usually over the next 12 months. It comes with a rating, like Buy, Hold or Sell, and a research note explaining the call.
Analysts update them all the time. They raise or cut a target after earnings, after a big product launch, or just because the stock has moved. When you see a headline like “Morgan Stanley reiterates Buy, $355 target”, that’s one analyst’s update.
The consensus price target is the average of all the recent targets on a stock. That’s the number most sites show first.
How I read the price targets on Apple
When I pulled up Apple’s forecast page on TipRanks on October 21, 2026, 32 analysts had rated it in the past three months: 16 Buy, 12 Hold and 4 Sell. TipRanks called that a Moderate Buy. The average price target was $337.18, with the highest at $400 and the lowest at $245.
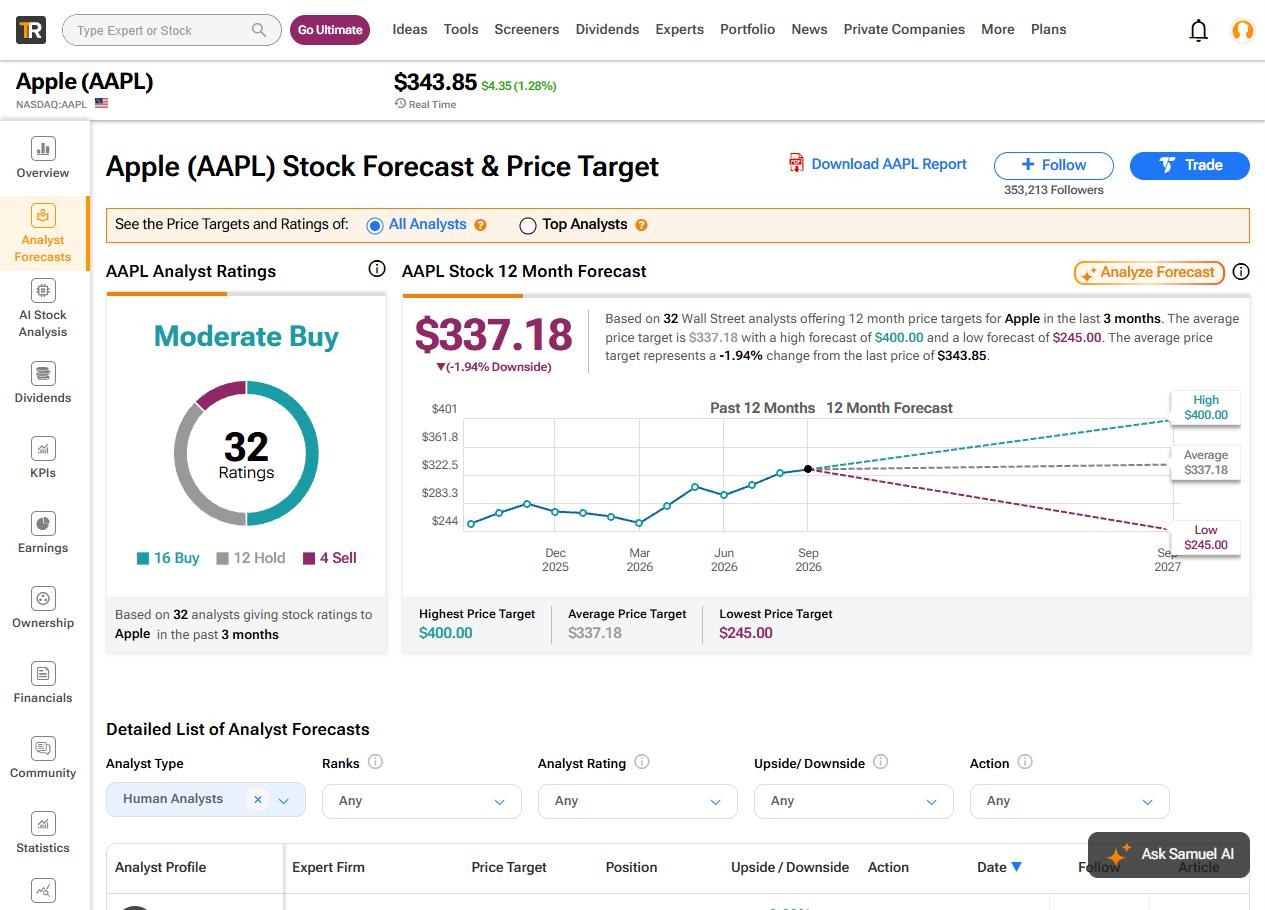
Here’s what jumped out at me. Apple was trading at $343.85 that day, so the average target sat 1.94% below the price. A Moderate Buy rating with a target under the current price looks like a contradiction, and it’s common. Targets lag. When a stock runs up, the price often passes the targets before analysts get around to raising them.
Look at the range too. Targets from $245 to $400 on a stock as widely followed as Apple tell you the analysts don’t agree. The average hides that.
Look at each analyst’s target, not just the average
Below the summary, TipRanks lists every individual call: the analyst, the firm, the price target, the rating, the upside or downside from today’s price, and whether they raised, cut or kept their target.
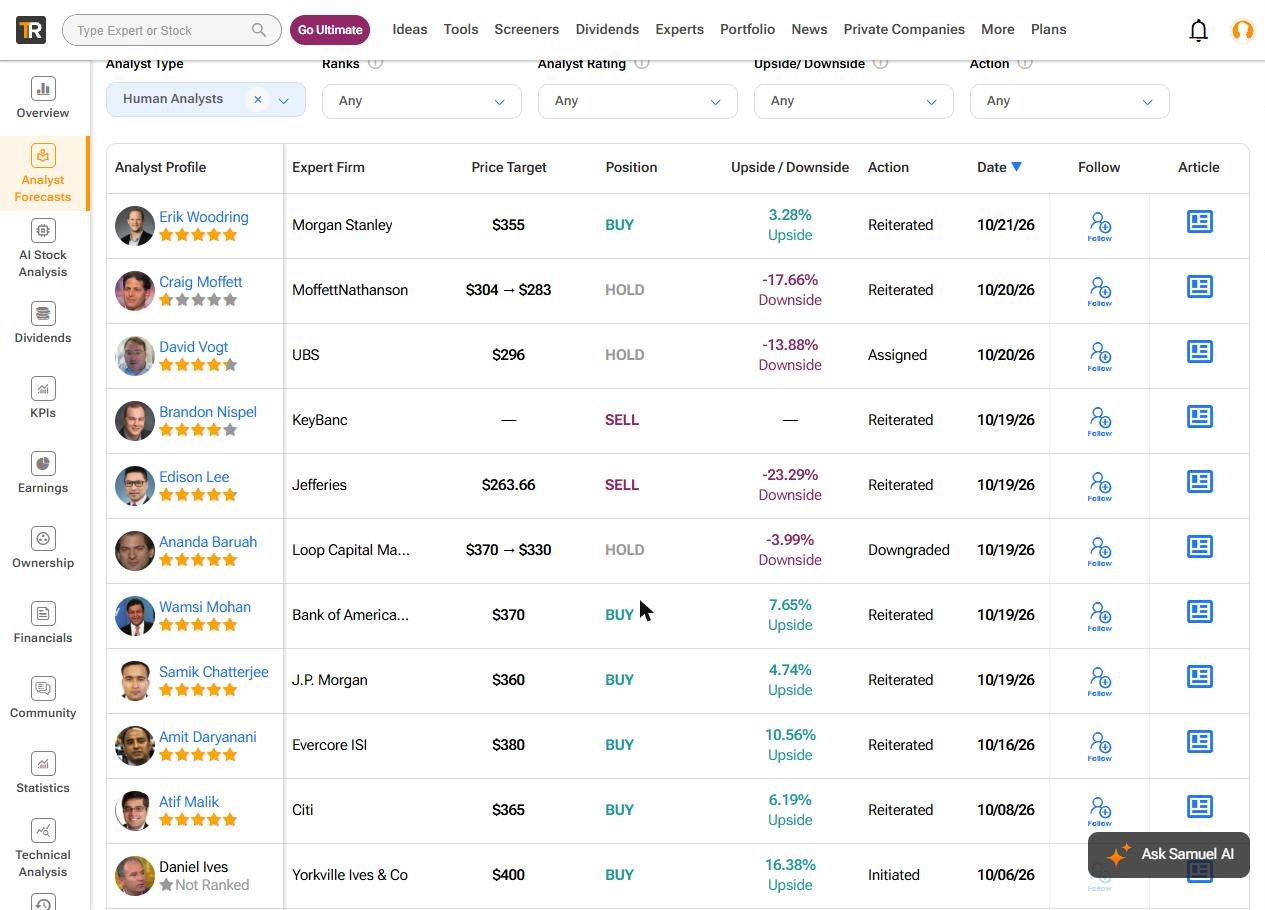
On Apple’s list that week, Morgan Stanley reiterated a Buy at $355. MoffettNathanson cut its target from $304 to $283 and kept a Hold. Jefferies had a Sell at $263.66, and Loop Capital downgraded to Hold while cutting from $370 to $330.
Watch which way the changes go. Two cuts and a downgrade within two days say more about where sentiment is heading than an average that includes targets set three months ago.
Price targets move, so check the date
I went back to the same page two days later, on October 23. Apple had climbed to $347.74. The All Analysts average hadn’t moved at all: still $337.18 from 32 ratings. The consensus can sit still while the price keeps going.
So check the date on each target. One set before the last earnings report is working off old numbers.
Get TipRanks Premium: 55% Off Yearly Plans, With a 30-Day Money-Back Guarantee
How accurate are analyst price targets?
It depends on the analyst, and that’s the part you can actually check. TipRanks tracks every rating an analyst makes and ranks them on three things:
- Success rate: the share of their ratings that made money. By default TipRanks measures each one over a year, or until the analyst changes the rating.
- Average return: the average return per rating over the same period.
- Statistical significance: how many ratings they’ve made. A great record on five calls counts for less than a good one on five hundred.
Every analyst gets a profile showing how many of their ratings made a profit and the stocks they cover, with each target and how it’s played out.
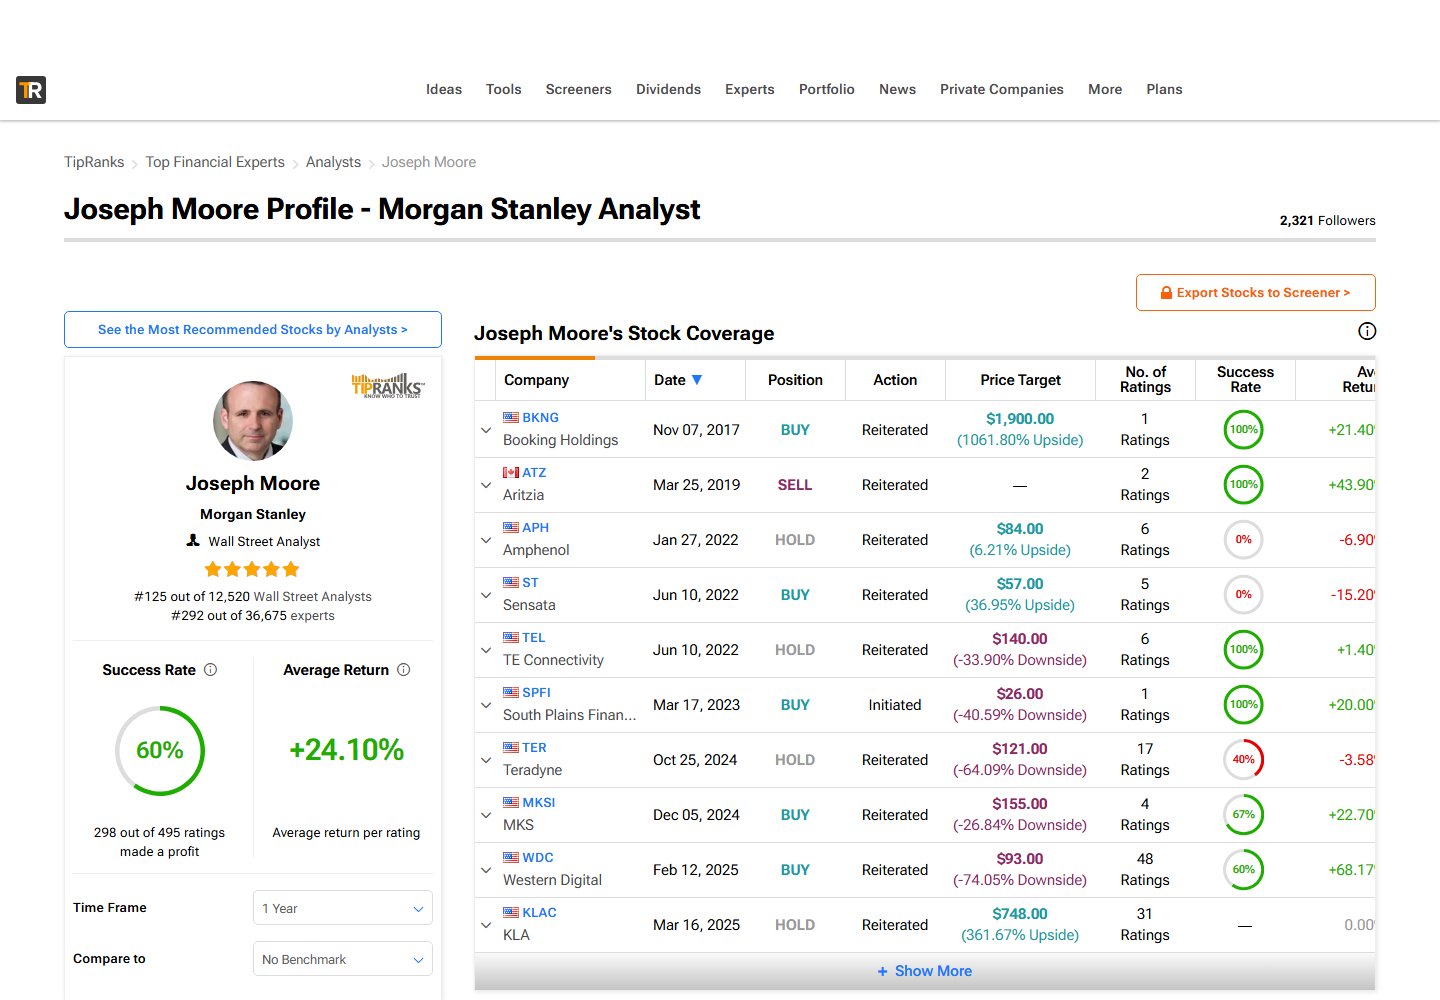
The rankings page puts them side by side. With Premium I can see the names, firms, number of ratings, success rate and average return for the top-ranked analysts. On the free plan the names are locked.
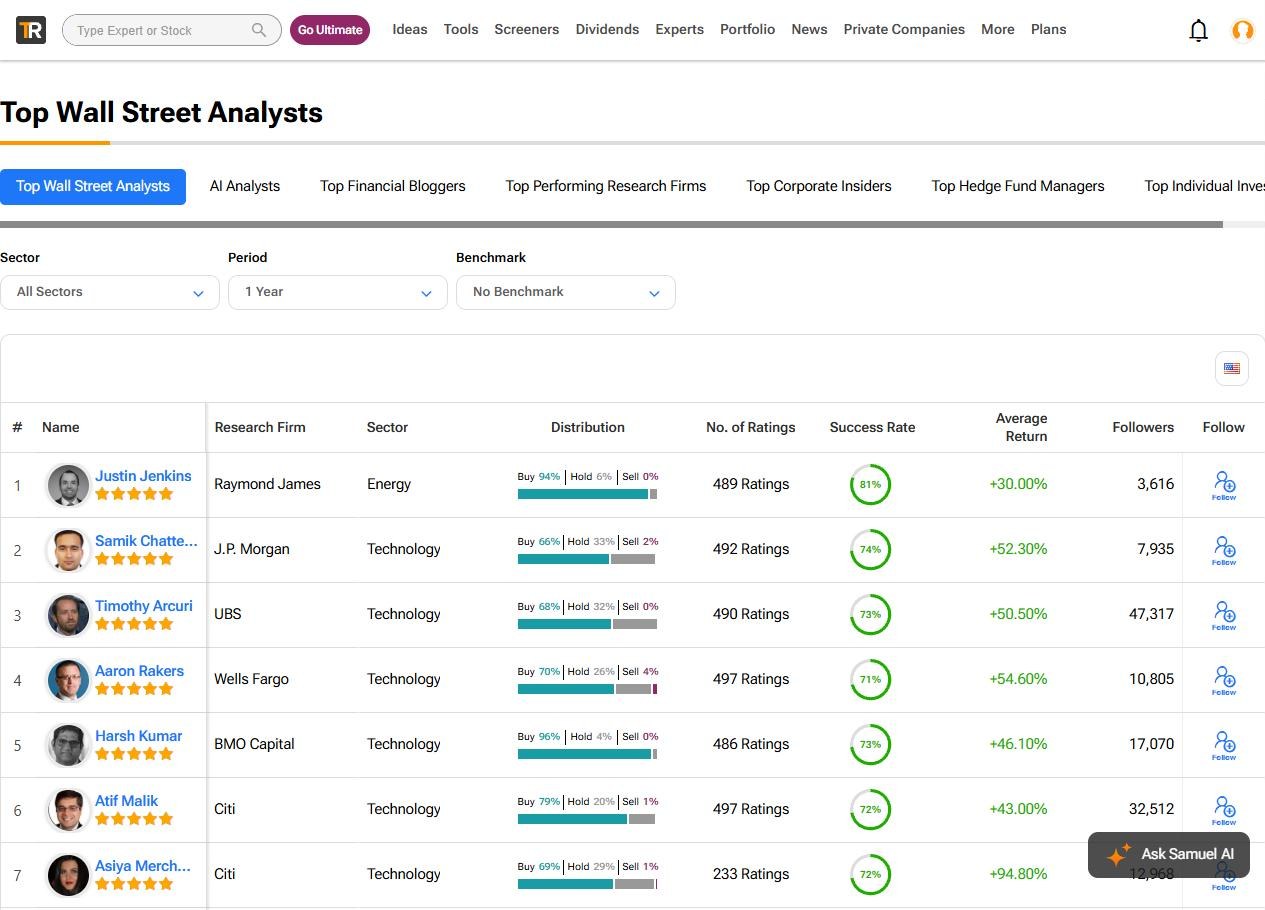
A track record isn’t a promise. These are past results, and a top-ranked analyst can still be wrong on the stock you care about. It does tell you whose target deserves more of your attention.
Filter for the analysts with the best records
On any stock’s forecast page, Premium adds a Top Analysts switch. It drops everyone except the best-performing analysts and recalculates the rating and the average target.
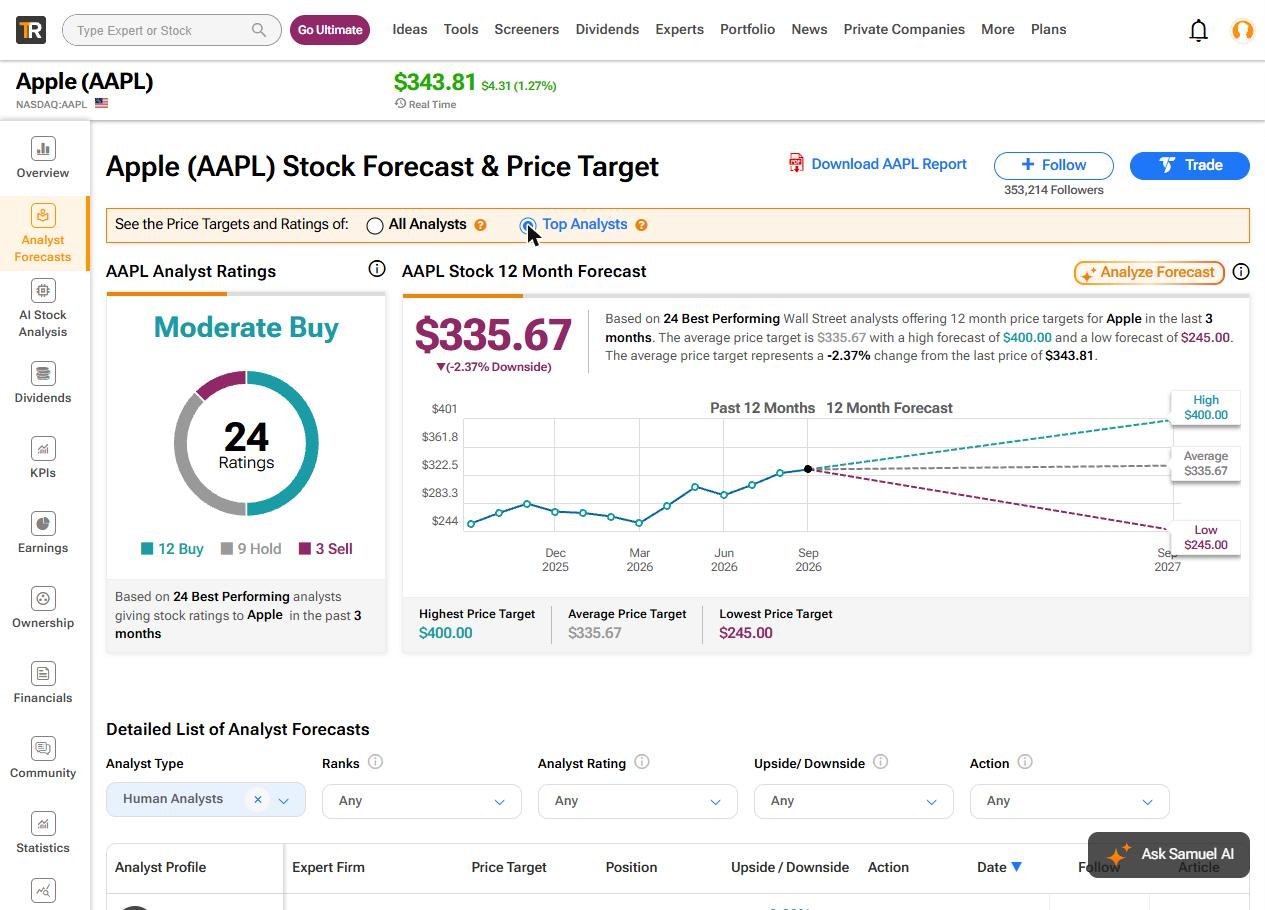
On Apple on October 21, flipping it narrowed 32 ratings to 24, and the average target went from $337.18 to $335.67. By October 23 it was 23 analysts and $333.20. The change was small on Apple because most of its analysts made the cut.
What TipRanks costs
You can see the consensus rating, the average target and the list of individual targets on TipRanks for free. The Top Analysts filter and the analyst names on the rankings are Premium.
| Plan | Price | What you get for price targets |
|---|---|---|
| Basic | Free | Consensus rating, average target and each analyst’s target |
| Premium | $13.50 a month, billed annually ($161.55 for the first year) | Adds the Top Analysts filter and unlocks analyst names in the rankings |
| Ultimate | $22.50 a month, billed annually | Everything in Premium plus complete expert rankings and research firm rankings |
Prices are with the 55% off yearly plans as of October 21, 2026. Yearly plans come with a 30-day money-back guarantee.
How to use analyst price targets
Here’s the checklist I run through on any stock:
- Compare the average target to today’s price, but don’t stop there.
- Look at the high and the low. A wide spread means the analysts disagree.
- Read the last few changes. Are targets going up or getting cut?
- Check the dates, and give less weight to targets set before the last earnings report.
- Check who’s making the call, and how their past calls have done.
A price target is one input. It isn’t a reason on its own to buy or sell a stock. Used this way, it’s a quick read on what the people who follow a company full time think, and how much they agree.
Filter Every Stock’s Targets to the Top Analysts With a Yearly Premium Plan
FAQs
It’s the price an analyst expects a stock to reach, usually within 12 months. It comes with a rating such as Buy, Hold or Sell, and analysts revise it as the company reports and the stock moves.
It varies a lot by analyst. TipRanks tracks each analyst’s ratings and shows their success rate, the share of ratings that made money, and their average return per rating, so you can see whose calls have held up.
It’s the average of the recent price targets from all the analysts covering a stock. On TipRanks it’s based on targets set in the past three months.
TipRanks shows the consensus rating, average price target and each analyst’s target on every stock’s forecast page for free. Filtering to the best-performing analysts takes a Premium plan.