
We delved into the balance sheet, income statement and cash flow statement. Now it’s time to put all these statements together and use financial ratios to analyze whether or not a business is a worthy investment.
Going Deeper With Ratios
OK, before we begin this final course, congratulations are in order. You’ve made it through the most important part of any course on investing—how to break down financial statements. You’re now in a position to go through a company’s fundamentals in a matter of minutes. Well done!
There are literally thousands of annual reports online, and with just a few clicks of the mouse you can get started. But before you do, we’ve designed this final course to help you on your way. It’s called “Putting It All Together” for a reason: it shows you how everything you’ve learned so far can be put together like pieces of a puzzle, to form a complete picture. That picture will then tell you whether investing in any particular stock is the right decision for you.
It’s Easy—Like Painting by Numbers!
We’ll paint that picture using ratios. We touched on ratios in “Evaluating a Business”, but now we’re going to go a lot deeper.
Ratios are relationships between certain financial aspects of a company. For example, the price/earnings ratio tells you the relationship between the stock price and the net earnings: if that ratio is high, it means that the price is high and therefore the company might not be such a good buy at the moment.
When you look at a company’s financial statements, it won’t surprise you that there are hundreds of potential ratios. We’re going to evaluate some key ones—or more specifically, we’re going to show you how to evaluate them. Using what you’ve just learned, we’re going to apply your knowledge to a giant of the food industry: Kellogg’s. At the end, you’ll decide for yourself whether Kellogg’s is the right company to put some Snap Crackle Pop into your portfolio…
An Overview of a Giant
Before we get into the financials, let’s just have a little look at Kellogg’s itself. While the numbers are the heart of an investment decision, it’s also important to have some understanding of the company itself, as well as its business.
Everybody Eats Breakfast…
If there’s one business to be in, it’s breakfast. After all, who doesn’t get up in the morning and eat food? (OK, aspiring supermodels, lots of teenagers, and some people on spiritual quests—but the remaining 7 billion people on earth all have breakfast.)
Kellogg’s is a giant in the breakfast business. In fact, it’s the biggest cereal manufacturer in the world, three times larger than its closest competitor. And here’s a whacky thing we bet you didn’t know: 30% of all cereal consumed in Mexico is eaten in the evening. That’s just one of the many fascinating facts you can get from Kellogg’s annual report.
And Kellogg’s doesn’t just produce cereals—or even food that’s only meant for breakfast. (Unless you’re in Mexico, where they eat Frosted Flakes at night.) As Kellogg’s itself tells you in that handy annual report, its products include “ready-to-eat cereals and convenience foods, such as cookies, crackers, savory snacks, toaster pastries, cereal bars, fruit-flavored snacks, frozen waffles and veggie foods.”
…and Everybody Eats Kellogg’s
Now to give you an idea of what that means, here are just some of the products Kellogg’s manufactures: All Bran, Apple Jacks, Bran Flakes, Corn Flakes, Coco Pops, Froot Loops, Frosted Flakes, Mini-Wheats, Mueslix, Nutri-Grain, Raisin Bran, Rice Krispies, Scooby Doo, Special K, Pop Tarts, Eggo Waffles, cracker chips, fruit crisps, morning shakes, cereal bars, morning sandwiches…
And that’s just a tiny part of their portfolio. Kellogg’s in fact produces over 100 different kinds of cereals alone (including Apple Jacks 72 Flavor Blast, and Mini-Wheats Blackcurrant—eeww!). So if you have breakfast and are more than two years old, there’s a good chance that you’ve eaten a Kellogg’s product.
OK, but what does this have to do with the Financials?
You need to have this kind of background information because Kellogg’s financials only make sense when you understand that it’s in the breakfast business. If there’s an economic downturn, people may put off buying cars for a year or two, but they won’t do that with breakfast. It’s a stable business, which means that Kellogg’s is guaranteed to have pretty steady sales. That makes it different from General Motors, or Apple, or Exxon—all of which are giants in their field, but can easily experience big swings in revenue from year to year. And that means they can be stock market stars one day, and stock market dogs the next. Remember, there might not always be an iPhone, but there’s always going to be breakfast.
Financial Statement Ratios
Alright, now we’re ready to dig into the ratios. We’ll do that in three basic steps:
- Calculate some important ratios using Kellogg’s Financial Statements.
- Review those ratios to see what they tell us about Kellogg’s.
- Decide, based on those ratios, whether Kellogg’s is a good investment.
First Ratio: Debt/Equity
You’ll remember from the course on the Balance Sheet that companies can finance growth by issuing stock or taking on debt. Financing with debt is called leveraging, and one measure of leverage is the debt/equity ratio:
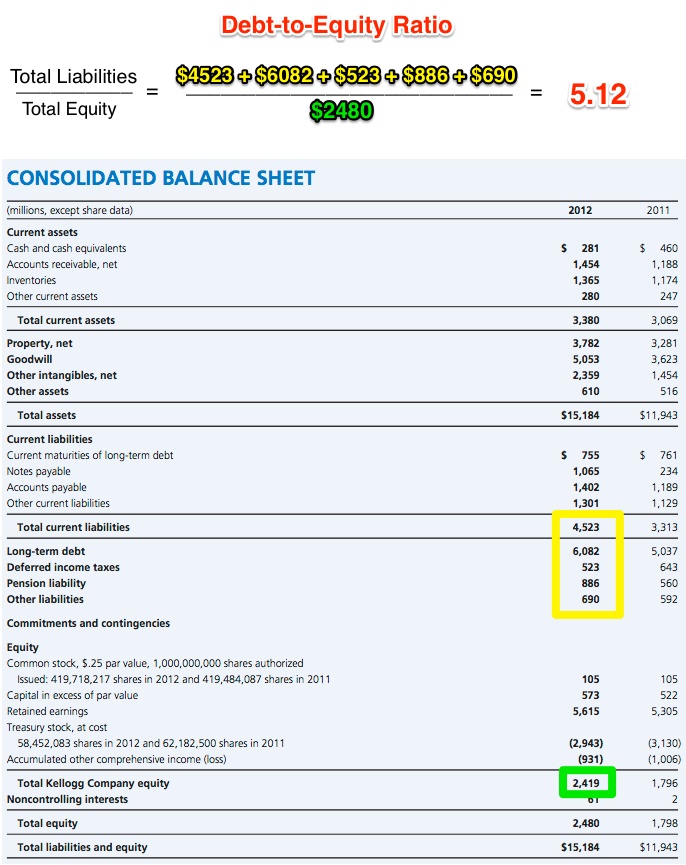
That’s a big number. When we looked at McDonald’s, its debt/equity ratio was 1.31.
Lots of Debt—Now How About Income?
So Kellogg’s is carrying a lot of debt relative to its stockholder equity, but hopefully that debt is being put to good use delivering revenue. Let’s take a look.
When we studied the Income Statement, we examined the Net Profit Margin for McDonald’s. That’s one of the most basic measures of what a company is supposed to do: make profit from selling goods or services. Here’s the Net Profit Margin for Kellogg’s:
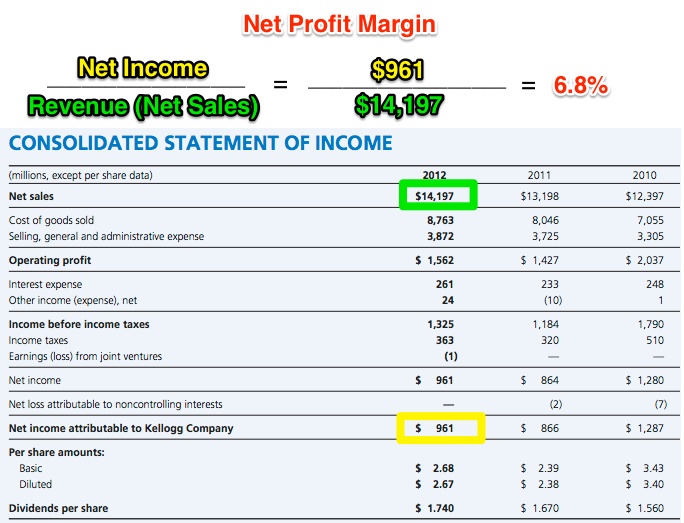
Now the nice thing about Kellogg’s Annual Report is that it provides financial figures for three years in a row. So for 2011 this figure was 6.6% and for 2010 it was 10.4%.
We also looked at Gross Profit Margin for McDonald’s. That’s another measure of profitability, and it shows what percentage of revenue is left over after subtracting the Cost of Goods Sold (COGS). Gross Profit Margin is expressed as
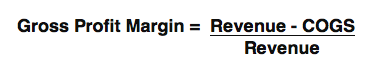
For Kellogg’s in 2012, Gross Profit Margin was 38.3%. That compares with 39.0% in 2011, and 43.1% in 2010.
Finally, there’s another profitability ratio that’s worth examining, and it’s called Return on Assets (often referred to as ROA). Its formula looks like this:
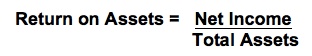
So in the same way that the assets in your bank account generate a return (in the form of monthly interest earned), Kellogg’s ROA shows that its assets are also generating a return.
But just because a company is profitable doesn’t mean its future is guaranteed. Remember from our course on Cash Flow that if a company runs out of cash to run its business, it could end up dying—even if it is highly profitable. So how is Kellogg’s doing on cash flow? Let’s find out…
More Financial Ratios
One of the best measures of a company’s ability to run its business is Operating Cash Flow as a percentage of Revenue. Operating Cash Flow is the cash flow that comes from a company’s sales activities (as opposed to investing and financing). An example of this is selling things like Pop Tarts, Special K, and Froot Loops: that’s the heart of Kellogg’s business. This ratio tells you how much of Kellogg’s’ revenue comes from that core activity, and it’s written as
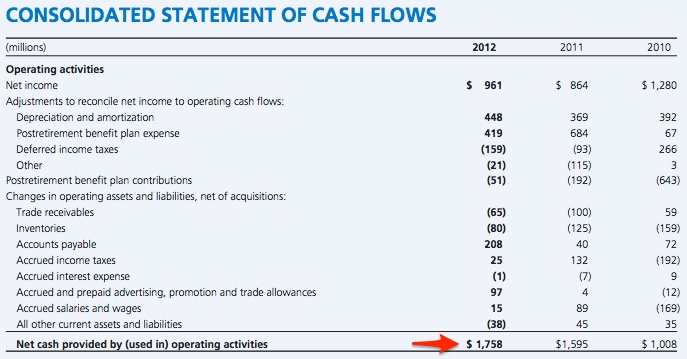
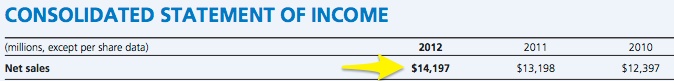
For Kellogg’s in 2012, that ratio came to $1,758/$14,197 = 12.4%. In 2011 the ratio was 12.1%, and in 2010 it was 8.1%.
It is important for operating cash flow to increase as sales increase—otherwise the company is having a hard time collecting on those sales. For Kellogg’s, its operating cash flow did increase: in fact, operating cash flow increased more than sales between 2010 and 2011, because this ratio went from 8.1% to 12.1%.
Finally, Valuation Ratios
OK, we’ve looked at some important financial ratios for Kellogg’s. Now let’s finish up with ratios that tell us about how shares of Kellogg’s are valued on the market.
The best-known ratio in the world of investing is the price/earnings (PE) ratio. That tells you how high the price of a share is relative to how much that share earns.
Now this is a very important ratio, so you really want to make sure you understand it. Let’s think of a cow, shall we?
A Farmer and a Cow
If you were a farmer, and someone offered you a cow, you’d want to know how much milk it produced. If it produced only a small amount of milk, you might not want to have it: why pay for a cow that’s not going to produce much over the years?
On the other hand, if it produced a lot of milk, you’d be interested. But you’d also want to know the price. If the price was a lot higher than other cows, you’d probably wait for another cattle auction. But if the price was quite a bit lower than that of other cows just like it, you’d want to buy it right away, before other farmers came along and started offering higher prices.
The PE ratio gives you that information: it tells you how much does a share cost, relative to the income it produces. It’s written as
Share Price/Earnings per Share
To calculate it, we look up Kellogg’s share price on December 31, 2012: $55.85. And from the Income Statement, we see that the company’s earnings per share were $2.68. So Kellogg’s P/E ratio is $55.85/$2.68 = 20.8.
And for our last ratio we’ll look at something called Dividend Yield. Many companies pay out dividends to their shareholders every quarter, and that payment makes them attractive to some investors. The Dividend Yield ratio is expressed as
Annual Dividend/Share Price
For Kellogg’s, the Dividend Yield in 2012 was $1.74/$55.85 = 3.1%.
Now let’s get to the heart of the matter: what do all these ratios tell us?
Evaluating Kellogg’s
Is Kellogg’s only good for breakfast, or will it provide a wholesome energy boost for our portfolio? Let’s review those ratios and see.
Debt/Equity
The first ratio we looked at told us that Kellogg’s is carrying quite a lot of debt. If we only look at interest-bearing liabilities, Kellogg’s debt-to-equity ratio was 3.19. On average, other big companies in the same industry have total debt/equity ratios around 2.0, as you can see from the industry statistics on the right-hand side of this chart (expressed as a percentage).
What this means is that Kellogg’s is a highly leveraged company. Sure, it’s a giant, and it’s got that guaranteed demand for breakfast products—but even giants can fail. Think of what might happen if interest rates started to rise: more and more revenue would be eaten up by interest payments, which would hurt profitability. Over the long term, the share price would drop, and the company might even have to reduce its dividend. We’d have to say that this ratio is a warning flag.
Net Profit Margin, Gross Profit Margin, and Return on Assets
We saw that Kellogg’s net profit margin dropped between 2010 and 2011, and in 2012 it stayed basically the same at 6.8%. So how does that compare with McDonald’s?
Well, McDonald’s had a net profit margin of 19.9%—which really blows Kellogg’s out of the water. And although McDonald’s is in a slightly different sector, in many ways the two companies are comparable. Both are multinational giants, both produce food, both have huge brand recognition, and both are in industries that are mature. On this measure, McDonald’s looks a lot stronger
But when we compare Gross Profit Margin (GPM), Kellogg’s seems to pull up its socks. McDonald’s came in at 39.1%, while Kellogg’s GPM was 38.3%. That means that both companies have around 40% of their revenue left over for other things, once they’ve produced the goods they sell.
So McDonald’s has a big chunk of change with which to devise new kinds of salads and frothy flavored coffees; and Kellogg’s has a similar share of its revenues to devote to makeovers for Tony the Tiger and that Froot Loops bird. Both companies depend on these kinds of marketing activities to grow sales, and on that financial score there’s not much difference between them.
And finally, Return on Assets. Both companies have trucks, warehouses, real estate, processing plants, and lots of other assets. But Kellogg’s ROA was only 6.3%, whereas McDonald’s was 15.4%. That means that McDonald’s is making much better use of its assets to produce money than Kellogg’s. Specifically, $100 of McDonald’s assets generates $15.40, while the same value of Kellogg’s assets produces only $6.30.
So one of these ratios tells us that Kellogg’s is holding its own against a McDonald’s, but two others say that it doesn’t measure up. Or, to put it another way, Ronald McDonald is stomping on Tony the Tiger’s tail, and Tony isn’t biting back.
Evaluating Kellogg’s (Cont’d)
Operating Cash Flow as a Percentage of Revenue
Now let’s review cash flow. We saw that for operating cash flow as a percentage of revenue, Kellogg’s improved its performance quite a bit between 2010 and 2011. Not only that, it kept that performance up in 2012 which is a good sign.
But improvement only tells us if a company is getting better—not if it’s actually performing well. To understand the difference, let’s compare Kellogg’s performance with McDonald’s again. In 2012, McDonald’s ratio was 25.3%. And Kellogg’s? Oh yeah, it was 12.1%.
What that says is that McDonald’s doesn’t have to worry at all about having enough money on hand to keep its operations going, whereas Kellogg’s seems to be running its business without much breathing room. So while we’re reassured that Kellogg’s is improving its operating cash flow (in 2010 this ratio was at a dismal 8.1%), we’d like to see if it can start looking a little more like McDonald’s.
Valuation Ratios
Let’s return to those valuation ratios and see what they tell us about Kellogg’s. Its PE ratio was 20.8. Is that good? Bad? Indifferent?
On its own, that’s hard to say. Obviously the PE ratio for a new company in a business that’s only getting going (think of Facebook) will be very different from the PE ratio of a company that is long established (like Kellogg’s). That’s why the PE ratio really only has meaning when you’re comparing it to a similar company in a similar line of business. And that’s what we’re going to do right now, using McDonald’s again…
McDonald’s PE ratio at the end of 2012 was 16.3, versus 20.8 for Kellogg’s. On that measure alone, McDonald’s looks like a much better buy.
Now let’s look at the Dividend Yield. For Kellogg’s it was 3.1%. That’s a pretty good yield. Remember, that’s what you get every year just for owning a share of Kellogg’s. In this day and age of ultra-low interest rates, when savings accounts are paying maybe 1% and offering no chance of capital gains, a yield of 3.1% is pretty good.
But how does it compare with McDonald’s? Its Dividend Yield was 3.2%—one-tenth of a percentage point higher. So not only does a share of McDonald’s cost less compared to what it earns, it also gives a slightly higher dividend yield. It looks like Ronald McDonald is not only stomping on Tony the Tiger, he’s also crushing the Froot Loops toucan and strangling the Special K rooster. It’s financial mayhem in the barnyard! (Kind of what you expect from Ronald McDonald—clowns are creepy.)
Putting Kellogg’s Into Context
As this little tour through financial ratios has shown, Kellogg’s doesn’t scream “Buy!”. On the plus side, it’s a well-established company with a huge market share. And it’s providing something that people will demand forever—breakfast.
On the minus side, it’s carrying a lot of debt that could cause problems down the road—especially if interest rates rise. In addition, while it is profitable, it certainly isn’t as profitable as another well-established company with a huge market share—McDonald’s. On top of that, McDonald’s is priced at a much more attractive valuation relative to its earnings, and it’s paying a tiny bit more in terms of dividends.
Delving Deeper
Based on what we’ve seen, McDonald’s looks like a better buy. But this has only been a quick summary of ratios. There are literally hundreds more that you can look at, and they might begin to tell a different story about Kellogg’s.
You also have to remember that you’re not investing for today: you’re investing for tomorrow. If other investors think Kellogg’s is worth buying at a PE ratio that is much higher than McDonald’s, then maybe they know something that these ratios aren’t showing.
That’s why it’s important to put all this information in context. Read the annual report of Kellogg’s to see what it tells you. (Hint: in 2012 Kellogg’s bought Pringles. That’s one of the reasons it has high debt, and also why its revenue grew a lot. Maybe investors think that over time the addition of Pringles will really help Kellogg’s grow its profitability.)
In addition, you should always compare the company you’re looking at with a true competitor. While McDonald’s does sell food, it’s not in exactly the same business as Kellogg’s. Maybe those investors who believe in Kellogg’s have looked at McDonald’s and decided that its future isn’t so bright. After all, it’s not nearly as diversified as Kellogg’s, and it’s selling food that isn’t necessarily the favourite of the health conscious. If people start getting serious about losing weight, you can bet that McDonald’s will be one of the first companies to suffer, while Kellogg’s could be a big beneficiary. (Soda, Big Macs, fries…they pack a lot more of a dietary wallop than Corn Flakes and All Bran.)
So if your heart is set on owning a packaged goods company, you should look at the fundamentals for companies like Kraft and General Mills, who sell a product line that is very similar to that of Kellogg’s. You also need to keep up on the news. Whatever is happening in the economy, in politics, and in world affairs can all have an impact on the stock market.
What we want you to walk away with is that there are dozens of ways to perform an analysis of a company’s business, hundreds of companies to compare it to, and thousands of ways to interpret your findings. But with your new knowledge of how to read financial statements, you’ll be better equipped than ever to decide which companies are a good buy—not only for today, but for tomorrow as well.
So now you’re ready to start doing it on your own! We’ll leave you with one more piece of advice—remember to always eat your breakfast!