The Discounted Cash Flow Model, or DCF for short, is one of the best ways to evaluate business performance. Cash flow is an essential part of any business, and with the Discounted Cash Flow model, investors are saying “show me the money!” This article covers the basics of DCF that every investor should know.
Introduction
In the business world—and in a lot of other places too—cash is king.
Cash is important in evaluating a business. Important enough that the pros use something called the Discounted Cash Flow Model, or DCF Model for short, to measure the value of a company. And it’s all about cash.
What is DCF?
Discounted Cash Flow is not the be-all and end-all of valuation techniques. After all, a company could do really well on the DCF measure, but if its management is like the folks at Dunder Mifflin, you might want to avoid it as an investment.
But DCF provides great insight into a company. It looks at how much money is coming in (through things like sales) and how much is going out (through things like the cost of goods it’s buying). That tells you how liquid the company is: i.e., will they be able to pay their bills in six months, or are they going to go bankrupt tomorrow? And that, folks, gives you a pretty handy guide to its overall value.
Now it’s not quite as simple as that, and using the Discounted Cash Flow model isn’t an exact science. But if you do want to understand valuations, you need to have some idea of how DCF works.
Unfortunately, that means more math. So plug in your pencils and sharpen your calculators…
What is Free Cash Flow?
OK, we mentioned that the DCF model is about measuring cash that’s coming in and going out. We start our Discounted Cash Flow with something called FCF: Free Cash Flow. That’s operating cash flow minus capital expenses.
-
Operating cash flow: the money a company generates through its core business.
-
Capital expenses: the money a company spends on its physical assets.
Factors Affecting FCF
Before we get into the details, let’s step back and think what that means. It’s the cash that’s left over from operations once a company has taken care of the physical assets (like buildings, trucks, equipment) it needs to stay in business. And that’s a good measure of how much money is left over to do things like buy new equipment, purchase another company or pay dividends to shareholders.
Like we said, this isn’t an exact science. But to give you an idea of how to do calculate FCF, we begin with a company’s sales revenues—because that’s the money it generates from its core business.
Subtract from that
-
operating costs (things like employee salaries, keeping the place clean);
-
taxes (no avoiding them);
-
net investment (if you add a yoga studio for employees next to the cafeteria, that’s a cost); and
-
changes in working capital (OK, this is a complicated one: working capital is current assets minus current liabilities—think of it as assets you can use in the short term versus liabilities you have to pay in the short term)
These figures can be found in a company’s annual report. And the great thing about our model is that we can use figures from today to estimate free cash flow in the future. That’s a really useful estimate to have if we want to figure out what a company is worth; in fact, it’s key to helping you decide whether a company is undervalued (in which case you want to buy its stock) or overvalued (in which case you’ll want to avoid it).
How to Calculate Free Cash Flow

Crunching all the numbers is far too complicated to go through here, so we’ll provide a simple example.
Let’s say you’ve got a company that has sales of $150,000. You can then estimate sales figures for the next four years, based on things like previous sales growth, or forecasts from the company, or how much the economy is expected to grow.
But BE CONSERVATIVE. Like we said, this isn’t an exact science, and it’s better to err on the side of caution.
Once we’ve done that, we then estimate the other factors that go into FCF.
Operating Costs
We can look up operating costs, and when we divide that by revenue, we get something called the operating margin. Here’s an example of how we get it:
The company’s annual report tells us that operating costs for last year were $82,500. (Obviously this isn’t a huge company, but they’re still kind enough to provide us with an annual report. Sweet!)
The revenue it generated from its regular sales was $150,000.
We then get $82,500$150,000 = 55%. And that 55% is the operating margin.
And here’s the neat thing. You can project that margin onto future years—maybe adjust it up or down a little according to how conservative you want to be—because you can be pretty sure that this company’s efficiency is not going to suddenly change from year to year. And that means operating costs will move in step with revenue: if sales really jump one year, costs will jump too, and if they drop then costs will also fall. And it’s reasonably safe to assume that the relationship between costs and revenue is going to stay within that 55% range over the short term—which makes the operating margin a really useful concept.
Once you’ve made your calculation for Year 1, you repeat it for the next four years using the projected sales estimates for each year. You now have projected operating costs for your whole period.
Taxes
The same applies to taxes. It’s a pretty safe bet that the tax rate won’t change by much between now and five years (not guaranteed, because governments sometimes do fiddle with it, but a safe bet). And to figure out the tax rate, you don’t even need to call up the government (which is good, because you’d be on hold FOREVER!). All you need is information found in a company’s public documents, like the annual report. Let’s see how.
Assume the company paid $13,600 in taxes last year. The report also tells you that before-tax profits were $55,000. (You can see where this is going, right?) So you divide taxes by profits like so:
$13,600$55,000 = 24.7%
And that’s your tax rate. You can now use that rate of 24.7% for every year of your calculations to figure out how much the company will pay each year, based on projected sales, costs and profits.
The Other Stuff
Net investment and changes to working capital are a bit different: these items might vary quite a bit. For example, the company might have spent a lot on brand-new equipment this year because it had to replace some really old machinery. Or it might have a big loan coming due this year, but it won’t have any debt to pay in the next few years. But you can still estimate what these items will be in future years based on past experience and what the company says about them in its annual report. Again, be conservative—this time by bumping your estimates up (since these items are subtracted from revenue).
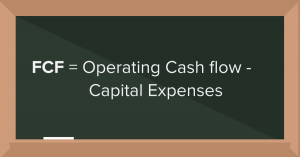
And here’s what a sample table might look like with all the numbers we need to calculate FCF.
Next up, we have to find the discount rate.
The Discount Rate
Huh? Why the discount rate?
For the individual investor, a typical rate is what you’re getting paid on your savings account at the bank. For businesses, though, it’s different. They use a method called WACC.

What is WACC?
Weighted Average Cost of Capital. This is basically the cost of capital, but it’s not always so straightforward to determine.
To understand WACC, you have to understand how businesses raise money. They can either use debt (borrowing money and paying it back with interest), or they can use equity (issuing shares to investors).
Say you have one source of capital, like a loan you took from a bank. Your cost is obvious: it’s the interest you pay. But what if your capital consists of two loans, each with a different interest rates? Nah, you can’t just add the interest rates together and divide by two. You have to weigh the relative sizes of the loans, to make sure that the interest rate on the big loan accounts for its larger share of your total interest costs, and the rate on the small loan accounts for its correspondingly smaller share.
That concept applies across as many loans as you have. And it also applies to equity that you borrow—because, as we said, that’s another source of capital, and it has a cost too.
Let’s look at the cost of equity and cost of debt separately.
Cost of Equity Calculation
Equity doesn’t have a specific monetary cost associated with it, the way debt does; but it does have a cost.
The thing is, when shareholders buy shares, they want them to go up in value, not down. (Shareholders—management’s biggest pain!) If shares drop in value, shareholders get ticked off. It gets harder to attract other shareholders, so issuing new shares raises less money than before. Declining shares are not a good thing. You want to keep shareholders happy.
The idea behind the cost of equity is that it costs the company to use other people’s money to fund their business. Now that cost is what it takes to keep shares at a value that keeps shareholders (relatively) happy. And mathematicians have come up with another formula to express it. (Seriously, mathematicians are whack!) It looks like this:
There’s no need for a detailed explanation of this, because we happen to have a handy WACC calculator a couple of paragraphs down. (Yay, mathematicians!!)
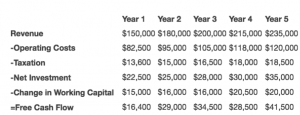
But we’ll give you the basics. The cost of equity is Re, and is equivalent to the risk-free rate, Rf, (and remember, we studied that in Chapter One—it’s basically the return on Treasury bonds) plus a premium. The premium is different for every company and is related to how volatile a company’s valuation is on the market.
Beta is the measure of that volatility.
If Beta = 1, then the company’s shares move in tandem with the market.
If Beta is less than one, then the shares move less than the market, which means the company is pretty stable. (Think of something like grocery stores. During a huge market crash, like the one in 2008, grocery stocks will be taken down like everyone else. But people still have to eat. Sales won’t drop nearly as much in the grocery sector as they will in most other industries, and that means grocery stocks won’t drop as much either.)
If Beta is more than one, then the shares move more than the market, which means the company is, well, not necessarily unstable…but certainly less stable than a lot of other companies. (Think of airlines. In boom times people take lots of vacations and planes are full. But when the economy goes south, those expensive trips to Europe are one of the first things people cut back on: airline stocks will reflect that, and drop more than the rest of the market.)
Then there’s Rm – Rf. Rm is the market rate, or the overall average return of stocks on an index, like the S&P 500. And Rf, as you remember from up above, is the risk-free rate.
So, as an example, let’s say Beta = 0.5. (This is a pretty stable stock.) And this year the S&P gained 10%, and we’ll suppose that Treasury Bills are paying 3%. So we have
Re = 3% + 0.5(10%-3%) = 3% + 3.5% = 6%
And that’s your cost of equity: it shows how much it’s costing you to put your money in the company’s shares instead of something ultra-safe like Treasury bills.
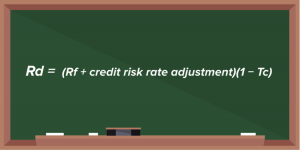
Cost of Debt Calculation
The cost of debt calculation is much more straightforward. It just takes the risk-free rate and adjusts it for how much debt versus equity the company is holding and what the company’s tax rate is.
****should we use an example with numbers for both the Rd and the Re or is this a good spot for a video
Once we know Re and Rd, we can move on to the WACC.
The WACC
The WACC brings the cost of equity and the cost of debt together. It assigns a weight to each of them based on how much they each account for the company’s total capital.
A high WACC indicates the company isn’t creating a lot of value and may not be a good investment. For example, say a company has a return rate of 12%, but you calculate its WACC to be 15%. That means that for every dollar the company spends, it’s destroying 3 cents of value. A low WACC is the opposite. If the company has 12% return and a 7% WACC, that means it’s creating 5 cents of value for every dollar it spends. And here’s the equation:
OK, that looks pretty painful, but it’s really not so bad. First off, E and D.
-
E is the company’s total equity,
-
D is the company’s total debt.
You can find those easily on a balance sheet. Not so tough, right?
V is just E+D—the total market value of the company’s financing.
Re is the cost of equity, and Rd is the cost of debt. We just did that up above! And that just leaves Tc.
Tc is the corporate tax rate. It’s the same Tc used in calculating the cost of debt. You can find it in an annual report. You can ask an accountant. Or you can just use this handy WACC calculator that we promised you earlier. We’ll even give you some fake numbers to plug in for our imaginary company.
Here they are:
-
E = $600,000,
-
D = $400,000,
-
Tc = 24.7%,
-
Re = 6%,
-
Rd = 8%.
Yes! You got a WACC of 6.01%.
You did it!!
Terminal Value
OK, give yourself a pat on the back for having come this far. Now we’re getting to the heart of the matter: figuring out what a company is REALLY worth.
To do that, we need to talk about one more thing: terminal value.
Setting a Terminal Value
Remember how earlier in the course we estimated cash flows for the next five years? That gave us some idea of how much money the company would have to toss around for a while. But what about after that?
Here’s where things get a bit tricky. We already took some liberties by estimating what cash flow would be for five years. And we sure don’t want to get too cocky and think we can start predicting things like that for 10, 15, 20 years. That’s just asking for trouble. So what do we do to figure out how much value the company will generate over the long term?
Step up, mathematicians!!
Mathematicians (and accountants, and investment pros in general) get around this problem by defining all future cash flows for the company as its terminal value. And this is where we use something from Chapter One that seemed kind of useless at the time:the perpetuity.
Yup, the good old perpetuity that has almost no real-world application (seriously, have you ever met anyone who owns a British consol??) but is really useful theoretically. We use it in something called the Gordon Growth Model, which assumes that growth will stabilize by the fifth year and then continue forever. Here is what it looks like:
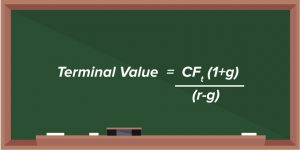
Again, this formula is not as scary as it looks.
CFt is just cash flow from Year 5—in the example above, it came to $41,500.
The discount rate (r) from WACC was 6.01%.
And all we have left is g, which is the long-term growth rate of the company.
That one is a bit of a guess. But it can be an educated guess. A startup might grow at some crazy rate—40%, 90%, 3,000% a year. But it won’t do that for long. And if the company is in an industry that’s mature, you can be darn sure that growth is going to be modest. There’s a range of figures you could choose here, depending on the company, the industry, the competition.
But like we said above: BE CONSERVATIVE. For our example, we’ll stick with a very reasonable growth rate of 3% annually over the long term.
All that’s left now is to plug in the numbers. We don’t have a calculator for you, but you can use your own.
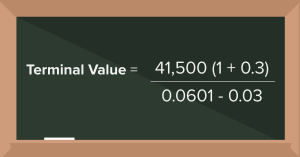
You should get a Terminal Value of $1.42 million.
And if you did, you’re now ready for dessert: how to fairly value a company.
Finding Fair Value
The fair value of a company is the value of all its projected cash flows, from now until eternity. We’ve already got most of that with the Terminal Value. Now all we have to do is add the cash flow for Years 1 to 5 to that number. Once we have the total, we convert it to Present Value using the discount rate.
Here are the numbers from our example:
| Year | 1 | 2 | 3 | 4 | 5 | Terminal |
| Free Cash Flow | $16,400 | $29,000 | $34,500 | $28,500 | $41,500 | $1.42 million |
And the WACC discount rate is 6.01%.
Using your calculator, plug in the numbers and find the Present Values for these cash flows. For the Terminal Value, the number of periods is 5 years; that’s because it is calculated from Year 6 to eternity.
(Note: you’re going to have to calculate the present value of years 1, 2, 3, 4, 5 and the terminal value separately….a little tedious, we know, but putting in the work will ensure that you have accurate information.)
Your results should look like this:
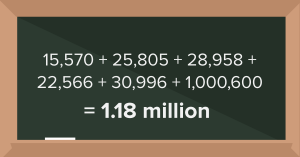
| Year | 1 | 2 | 3 | 4 | 5 | Terminal |
| PV of CF | $15,470 | $25,805 | $28,958 | $22,566 | $30,996 | $1.06 million |
Now add them all up for a grand total of….. $1.18 million.
Subtract Debt
But there is still one last step!
Remember debt? Yeah, most companies have debt, and that reduces their value because paying off that debt takes resources from cash flow. (Sucks, we know.)
In this example, our company had $400,000 of debt. We have to subtract that from our PV above, so we get…
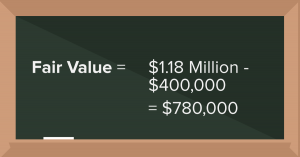
Ta-da! Now we know what the company is worth.
And we also know that you can do a Discounted Cash Flow valuation. Not bad, considering that just a little while ago you didn’t even know what DCF was.
Fair Value of Shares
Once we know what a company is worth we can see if other people—specifically, the market—know it too. Time to check the share price.
Let’s say the company has 100,000 shares, and they’re trading at $10 each.
If we take our $780,000 and divide by 100,000, we get a price of $7.80 per share. Yikes! That’s way lower than what they’re trading at.
That’s a very clear sign: avoid this stock. Once everyone in the stock market joins Wall Street Survivor and takes this course, they’ll realize they’ve overvalued the company. The share price will come down, and then you’ll be able to buy it for its fair value…
In theory.
Reality is a bit more complicated. We won’t go into all the reasons for why the stock might not be priced right, but at least you have the basis for evaluating the price and getting it (more or less) right. That puts you way ahead of most investors today.