Bond valuation is a technique for determining the fair price of a bond. The theoretical fair value is the present value of the stream of cash flows it’s expected to generate.
Now that you have a basic understanding of what bond ratings are, we’ll look at bond valuation and how you can use it to select your investments.
What is a Bond Valuation?
Bond valuation is a technique for determining the fair price of a bond. The theoretical fair value is the present value of the stream of cash flows expected. Bond valuation includes calculating the present value of the bond’s cash flow (future interest payments), and the bond’s par value (value upon maturity)
A bond’s par value and cash flow are fixed, so investors need simply to look to bond valuation to determine whether an investment in a particular bond would be worthwhile. It’s only one of the factors investors consider in determining whether to invest in a particular bond, though. Other important considerations are: the issuing company’s creditworthiness, the bond’s price appreciation potential, prevailing market interest rates, etc.
Bond Valuation Formula
Firstly, the present value of the bond’s future cash flows should be determined. The present value is the amount that would have to be invested today in order to generate said future cash flow. It’s dependent on both the timing of the cash flow and the interest rate. To figure out the value, the present value of each individual cash flow must be found. Then, you’ll simply add the cash flows together.
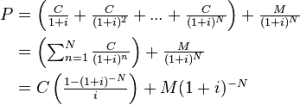
(Image source: Wikipedia)
- F = face values
- iF = contractual interest rate
- C = F * iF = coupon payment (periodic interest payment)
- N = number of payments
- i = market interest rate, or required yield, or observed / appropriate yield to maturity
- M = value at maturity, usually equals face value
- P = market price of bond
Bond Valuation Calculators
There are many tools available online to help you calculate a bond’s valuation, without having to do that crazy math computation on your own! Here are some popular ones:
There’s a lot to learn about bond valuation. It’s important to be able to understand the fair price of a bond before investing in it. Selecting an investment that is well suited for you can be a stressful experience. We’ve got you covered. Our Investing in Different Markets coursehttps://www.wallstreetsurvivor.com/starter-guides/what-are-bonds-how-they-work/ will teach you all about bonds.
Rank of Top Stock Newsletters Last 3 Years, as of June 27, 2026
We are paid subscribers to dozens of stock and option newsletters. We actively track every recommendation from all of these services, calculate performance, and share our results of the top performing stock newsletters whose subscriptions fees are under $500. The main metric to look for is "Return vs S&P500" which is their return above that of the S&P500. So, based on June 27, 2026 prices:
Best Stock Newsletters Last 3 Years' Performance
| Rank | Stock Newsletter | Picks Return | Return vs S&P500 | Picks w Profit | Max % Return | Current Promotion |
|---|---|---|---|---|---|---|
| 1. | Alpha Picks | +108% | +85% | 72% | 1,571% | July, 2026 Promotion: See all their picks & get $124 off |
| Summary: 2 picks per month based on Seeking Alpha's Quant Rating; consistently beating the market every year since launch; tells you when to sell and they have sold almost half. See complete details in our Alpha Picks Review. Or get their Premium service to get their QUANT RATINGS on your stocks to better manage your current portfolio--read our Is Seeking Alpha Worth It? article to learn more about their Quant Ratings. | ||||||
| 2. |  Zacks Value Investor | +36% | +22% | 44% | 441% | July, 2026 Promotion: $1, then $495/yr |
| Summary: 10 stock picks per year on January 1st based on Zacks' Quant Rating; Retail Price is $495/yr and includes 6 different services including those below. Read our Zacks Review. | ||||||
| 3. | Zacks Top 10 | +36% | +22% | 77% | 170% | July, 2026 Promotion: $1, then $495/yr |
| Summary: 10 stock picks per year on January 1st based on Zacks' Quant Rating; Retail Price is $495/yr and includes 6 different services. Read our Zacks Review. | ||||||
| 4. |  Action Alerts Plus | +31% | +12% | 64% | 449% | Current Promotion: None |
| Summary: 100-150 trades per year, lots of buying and selling and short-term trades. Read our Jim Cramer Review. | ||||||
| 5. |  Moby.co | +39% | 10% | 62% | 1,566% | July, 2026 Promotion: Get #1 Stock Pick Free |
| Summary: All it requires is an email address to get their #1 stock pick free; 60+ stock picks per year, segmented by industry; consistently beating the market every year; retail price is $365/yr but save try it for $99. Read our Moby Review. | ||||||
| 6. |  TipRanks SmartInvestor | +19% | +8% | 57% | 361% | Current Promotion: Save $180 |
| Summary: About 1 pick/week focusing on short term trades; Lifetime average return of 355% vs S&P500's 149% since 2015. Retail Price is $379/yr. Read our TipRanks Review. | ||||||
| 7. | Zacks Home Run Investor | +10% | +5% | 42% | 427% | July, 2026 Promotion: $1, then $495/yr |
| Summary: 40-50 stock picks per year based on Zacks' Quant Rating; Retail Price is $495/yr. Read our Zacks Review. | ||||||
| 8. | IBD Leaderboard ETF | 11% | -1.8% | n/a | n/a | July, 2026 Promotion: NONE |
| Summary: Maintains top 50 stocks to invest in based on IBD algorithm; Retail Price is $495/yr. Read our Investors Business Daily Review. | ||||||
| 9. | Zacks Under $10 | +1% | -2% | 35% | 263% | July, 2026 Promotion: $1, then $495/yr |
| Summary: 40-50 stock picks per year based on Zacks' Quant Rating; Retail Price is $495/yr. Read our Zacks Review. | ||||||
| 10. | Dogs of the Dow Strategy | +6% | --7% | 50% | 34% | Current Promotion: None |
| Summary: Buy the 10 highest yielding dividends stocks in the Dow Jones Industrial Average on January 1st and sell on Dec 31st each year. | ||||||
| 11. | Stock Advisor | +7% | -17% | 59% | 141% | July, 2026 Promotion: Get $100 Off |
| Summary: 2 picks/month and 2 Best Buy Stocks lists focusing on high growth potential stocks over 5 years; Retail Price is $199/yr. Read our Motley Fool Review. | ||||||
| 12. | Rule Breakers | +11% | -18% | 51% | 208% | Current Promotion: Save $200 |
| Summary: Rule Breakers is included with the Fool's Epic Service. Get 5 picks/month focusing on disruptive technology and business models; Lifetime average return of 355% vs S&P500's 149% since 2005; Now part of Motley Fool Epic. Read our Motley Fool Epic Review. | ||||||
| Top Ranking Stock Newsletters based on their last 3 years of stock picks covering 2026, 2025, 2024, and 2023 performance as compared to S&P500. S&P500's return is based on average return of S&P500 from date each stock pick is released. NOTE: To get these results you must buy equal dollar amounts of each pick on the date the stock pick is released. Investor Business Daily Top 50 based on performance of FFTY ETF. Performance as of April 5, 2026. | ||||||