
Net Present Value and Internal Rate of Return, or NPV and IRR, are 2 sides of the same coin. They both answer the question “Is this investment worth it?” The answer of course is “it depends” and today we’re going to learn how to determine the best projects to invest in.
What is Net Present Value?
Like its name suggests, NPV is all about value—specifically, present value. But present value of what? Well, what did we say was king in Chapter One? Cash. That’s right. NPV is the present value of cash that will come to you at some time in the future minus the value of the cash that you will spend in the present.
For example, let’s say a company decides to undertake a new project, like building a factory. That project will generate a cash flow. Net Present Value calculates what that future cash flow is worth compared to the cash you’re going to have to spend to get it. If NPV is positive, the cash flow will be worth more than the initial investment—that’s a sign that the company should undertake it. But if NPV is negative? Hey, the project will cost more than it will return! Don’t do it, CEO!!!! This idea is so important that it’s referred to as the Net Present Value Rule. The great thing about it is that you can use it to continuously evaluate your own investments.
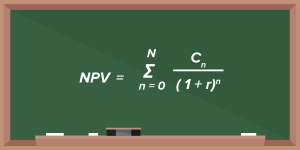
How NPV Works—An Example let’s take a closer look at the company that decides it’s going to build a new factory. We’ll start with the Net Present Value formula:
Scary, right?
Nah! You’ve got this
-
Ct is the cash flow in a particular period, t
-
T is the total number of periods you are looking at
-
t is time (i.e., what year you’re looking at)
-
r is our good old discount rate
And that squiggly Greek letter ∑? It’s just a mathematical symbol that means the sum of all your calculations for every period.
So you do the cash flow for Year One and divide it by 1+r. Then you do the cash flow for Year Two and divide it by (1+r)2. Then you do Year Three: cash flow, divided by (1+r)3. This is easy!!
Keep on doing it for every period until you’re finished, and then just add them all up. (That’s what ∑ is saying: it’s Greek for add ‘em all up. Hey, you just learned some Greek!)
And then the second part, Co.
That’s the total cost of the initial investment. You subtract that from the total of all your discounted cash flows, and voilà, you have your NPV! (Voilà is French for, “Wow, awesome!” You are really killing it here with the foreign languages.)
Let’s move on to an actual calculation.
How to Find Net Present Value
First we have to choose our variables. As we said in the last chapter, be conservative. If you choose a low discount rate, like r=1%, you can see right away that dividing by 1+r means your cash flows won’t be discounted by much. But if you choose a high discount rate, like r=10%, you’ll be dividing those cash flows by a much bigger number. That means their present value will be smaller.
And that’s being conservative—you’re making it harder for the project to get a positive Net Present Value, and harder for you to get over-excited by a company’s prospects.
For this example, we’ll choose a discount rate of r=8%.
We’ll look at a period of t=5 years—long enough for a project to get up and running and work out the kinks—and we’ll assume an initial investment of Co=$200,000.
Now all we have left is future cash flows (Cf). Again, being conservative is our watchword—if you underestimate future revenue, that just means you’ll have more cash than you had anticipated. Awesome! But if you overestimate it, you might have a big problem on your hand in a few years.
For this example, we’ll use the following cash flows:
| Year | 1 | 2 | 3 | 4 | 5 |
| Future Cash Flow | $30,000 | $35,000 | $38,000 | $42,000 | $45,000 |
And here’s your calculator. Plug in these future amounts to find the present value for each period.
If you’ve put in all the right numbers and pressed all the right buttons, you will have come up with this:
| Year | 1 | 2 | 3 | 4 | 5 |
| PV of Cash Flow | $27,777 | $30,007 | $30,166 | $30,871 | $30,626 |
Now, remember your Greek? Time to ∑!
Yup, add ‘em all up. You get $149,447.
Then, subtract the cost of the project. That was $200,000.
So now you’ve got $149,447- $200,000 = -$50,553.
That’s your NPV: -$51K.
Clearly, this is not a good project to undertake. The company is spending a lot more on getting it up and running than it will earn back over five years of operations. Shareholders will take a loss as a result, and this might be time for you to sell your stake and let some poor fellow who didn’t do his Net Present Value analysis buy into the company in your place.
Next up: IRR
Finding the IRR
Internal Rate of Return (IRR) is our last model. It’s the yin to NPV’s yang—basically another way of looking at the same thing.

The IRR is simply a discount rate. But not just any discount rate. It’s the discount rate where the NPV ends up being zero.
And here’s why it’s a useful number to know: it sets a minimum rate of return for the project, below which it just doesn’t make sense to undertake it.
Break-even point
To see how useful, let’s look at an example. A company is thinking about adding a new factory. It crunches the numbers, and finds out that the NPV is zero when the discount rate is 5%. And as it happens, the interest rate today is in fact 5%. So the company could invest a million dollars in building the factory, and the present value of money it will get back (from all the cash flow over the years)… is a million dollars. Heck, the company is no better and no worse off from doing the project or not doing it. They decide not to bother.
Now let’s say that six months after the company crunched the numbers, the discount rate drops to 3%. The execs read about this in various exotic destinations around the world. They text each other, really excited: “That new factory project we were looking at six months ago? It’s a go! Get back to headquarters!”
And how do they know that without having crunched the numbers yet? Because of IRR. At a 5% discount rate, the project was break-even. Below a 5% discount rate, the project has to be profitable because the NPV has now risen above zero. (If you don’t understand this, take a look at your NPV formula again. The interest rate r has gone down, which means the cash flow is being divided by a smaller number.) And of course, if the discount rate rises to 7% the execs also know they can keep working on their golf score for a while longer: the NPV was zero at a 5% rate, so now it is negative at a 7% rate. Makes more sense to keep that money in the bank and earn interest than waste it on a factory that will pay less than the bank does…
Another way of thinking of it is this: the IRR is the projected rate of return of the undertaking. A really high IRR says that you’re going to get a high rate of return from your investment, while a really low IRR tells you it’s not going to grow much at all.
And here’s your equation:
You’re not afraid of this by now, right? Piece of cake.
-
NPV is net present value, and we set it to zero.
-
N is the total number of years you’re looking at,
-
n is any given year (just like we did in the equation above).
-
Cn is cash flow for the year n,
-
r is the discount rate.
Maybe a little bit of fear is in order…
Actually, no. In this case, the equation actually is scarier than it looks. That’s because we’re trying to solve for r, not NPV. And that’s a doozy. (Try it—not so easy, huh?)
To solve it, you’d actually have to go through some trial and error, which can get complex and take a lot of your time. But fortunately, math geeks have made it a lot easier.
That’s right. Just like they did with present value, they came up with a calculator, and they have agreed to share it with us for free. Here it is.
Now just to give you an example, let’s say your company is going to build a new factory that will manufacture protective cases for smartphones. It’s going to cost you $1,000,000 to build this factory. You know that you have a guaranteed market for your products of $250,000 a year, but you also know that in precisely five years, no one will ever use a smartphone again–we’ll all be communicating by telepathy.
So, crunch the numbers. Your IRR calculator will show that over five years, you’ve put down a cash outflow of $1 million; you’ll receive a cash inflow of $1.25 million; and your IRR is 7.9309%.
And what does this tell you? If interest rates are 5%, do the project: you’re getting a return of almost 8% on it, while you’d only get 5% if you parked the money in the bank. But if interest rates are 9%, don’t do it–you’re better off keeping that money in a savings account.
Now let’s do another calculation. You can also buy a storefront where you can sell some of your smartphone cases. This is a rough area of town, so real estate is dirt cheap. In total, it’s going to cost you $30,000 upfront. You’ll sell $10,000 worth of cases a year, but after five years, POOF! The market’s gone. Crunch the numbers.
You should come up with a cash outflow of $30,000, a cash inflow of $50,000 and an IRR of 19.85%. This is a very profitable little enterprise you have here, even if it is in a sketchy part of town.
VIDEO: showing a step by step calculation of the IRR
Putting the two together…
A powerful formula is a good thing when analyzing a company. Two powerful formulas? A great thing. With these formulas by your side you can rule the financial world!

IRR and NPV really work best when used together, because they can give you a more complete picture on the value of an investment than each one on its own. For example, a low IRR can tell you that an investment will have slow growth—but if it has a high NPV as well, it means that it will still provide a lot of value. Like the smartphone-case factory in the example above: the IRR was not huge (good return relative to your initial investment, but not mindblowing), but because it’s a relatively big investment it’s NPV would be quite high and would add a lot of value.
The converse is also true. In our second example, we set up a storefront to sell smartphone cases—just so we don’t have to sell all our cases through WalMart. We came up with a high IRR, which means that the investment is in for a high growth rate. (And selling $10,000 a year, relative to an initial investment of $30,000 represents pretty high growth.) But that $30,000 investment is the catch. It’s just $30K–pocket change for a business like ours that also builds million-dollar factories. So NPV is going to be pretty low, and the store isn’t going to add much value to our overall enterprise.
And of course if your analysis comes up with high IRR and high NPV, then the project is a no-brainer. As an investor you can be confident that this new plan by the company is going to be adding a lot of value to the company pretty fast. Load up on the stock and watch the returns roll in!
As you use these two models more and more, you’ll get a better sense of how they work. Bear in mind that each has its pros and cons.
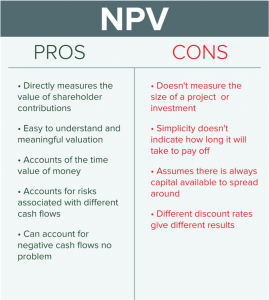
NPV: Pros and Cons
NPV is a great tool, because it considers the time value of money and (among other things) can let you play around with different discount rates. On the other hand, it doesn’t let you compare projects that well. The NPV Rule says go ahead with a project whose NPV is positive—but it doesn’t tell you how long it will take to turn a profit. It could take five years or it could take 15, and not knowing which one it is can be a big drawback.
Another problem with NPV is that it doesn’t help you allocate capital efficiently. Sure, if you had unlimited capital, you could use NPV to your heart’s content: for every new project with a positive NPV, just throw money at it. You know it’s going to pay off!
But in reality, you don’t have unlimited capital. You need to ration your capital, and decide where the biggest return will be. NPV doesn’t tell you that, because it doesn’t measure the size of a project. You could have a project with a great NPV, but if it’s just a piddly little investment of a few thousand bucks, why bother?
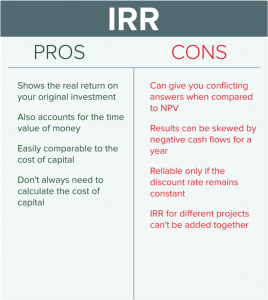
IRR: Pros and Cons
IRR also accounts for the time value of money, and it gives you a good sense of what a project’s return will be compared to alternatives, as well as to the cost of capital—in other words, it helps you prioritize.
On the other hand, one of the big drawbacks of IRR is its relationship to WACC. The idea behind IRR is that it tells you you should go ahead with a project where the return on it is greater than the cost of your capital, or WACC. But if your discount rate changes from year to year, your IRR will be changing too, and that means you can’t compare it with WACC. Another one is that you can’t add IRR from one project to IRR from another, whereas you can add NPVs together. That makes analysis more difficult for complicated projects.
So each method has its strengths and weaknesses, and using them together can help reduce those weaknesses—while enhancing their strengths. What all this is telling you is that you need to do a lot of work, and exercise a lot of judgement, when you’re doing value analysis. It’s not an easy method, and it takes effort. In the end, though, it’s worth it, because your analysis will be based on more than just gut instinct. It’ll be based on science (kinda).
Now you know how to use NPV and IRR to make investment decisions. Take the quiz to find out if you’re ready!