Dollar Cost Averaging
Investing in the stock market involves a lot of unpredictable factors. So many first time investors get scared off by not knowing what stock(s) to buy at what time. Timing the market is a daunting task, but thankfully there are strategies that take timing out of the investing equation.
Dollar Cost Averaging is an investment method that mitigates the risk of timing the market by dividing up initial investment over time. The concept is simple. Rather than trying to buy low and sell high, the investor picks a fixed incremental dollar amount to allocate over time.
Dollar Cost Averaging Example
For example, Investor A wants to invest $5000 in stock XYZ. He decides to buy 100 shares at the current price of $50 per share. His friend, investor B decides to buy $5,000 of stock in the same stock, but $1,000 at a time on the first day of the next five months (dollar cost averaging).
Stock XYZ Prices:
Month 1: $50
Month 2: $45
Month 3: $40
Month 4: $48
Month 5: $52
Month 6: $60
By month six, Investor A has $6000 with a $1000, or 20%, net return. Investor B however, has a total equity of $6,437 for a net return of nearly 29%. Investor B took advantage of the changes in price in order to net greater returns by splitting up his initial investment over time! By fixing a dollar amount invested per month, Investor B was able to buy more shares at lower prices and fewer shares at higher prices.
Not satisfied? Let’s take a look at a real stock: Tesla.
Dollar Cost Averaging in Real Life
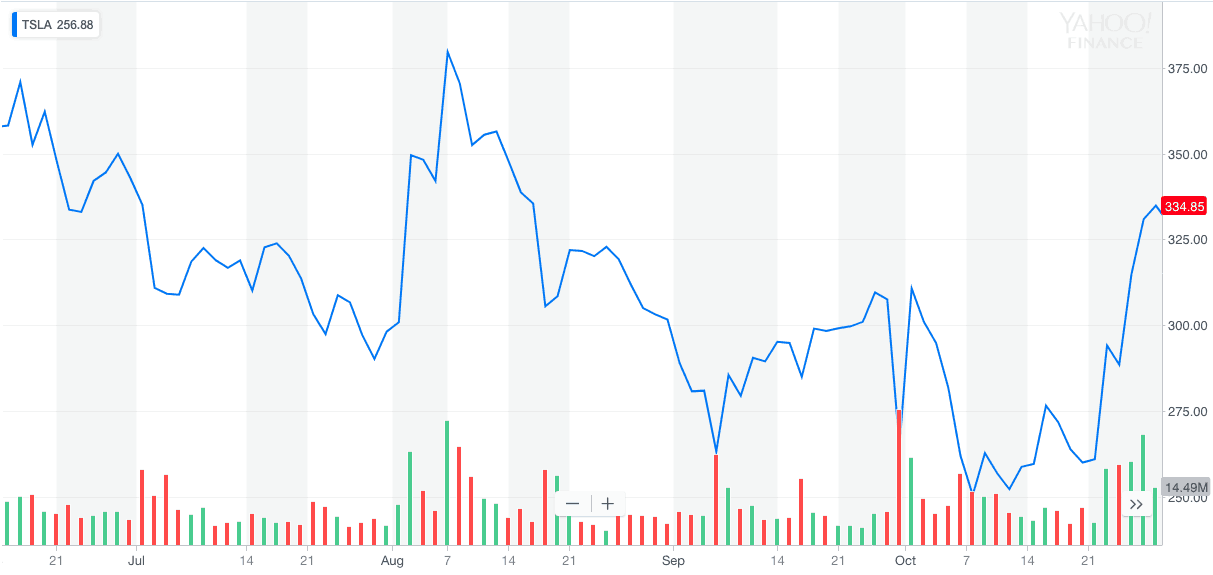
Tesla June 15, 2018 – October 29, 2018

Investor A decides to invest a lump sum of $50,000 into Tesla on June 15th, 2018 at a price per share of $354. Investor B also decides to invest $50,000, but in increments of $10,000 on the 15th of each month.
June 15: $354
July 15: $312
August 15: $342
September 15: $289
October 15: $260
Current Price: $333
At the current price, Investor A has actually lost money. His initial investment of $50,000 is now worth only $47,034. However, Investor B, who bought $10,000 worth of Tesla stock on the 15th of each month now has $54,146 for a net positive return of 8.3%.
While no investment method is foolproof, dollar cost averaging lowers risk for investors with long term investing goals. It’s not going to get you rich quick, but it is a smart way to make the most of changes in stock prices over time. Try dollar cost averaging with your Wall Street Survivor virtual portfolio today!
*** UPDATE -- Friday, July 18, 2025 -- MOTLEY FOOL STOCK ADVISOR AVERAGE RETURN OF ALL 500+ STOCK PICKS IS 872% VS THE S&P500'S 160% ****
The Fool investing philosophy is hold stocks for at least 5 years, invest regularly, and ride out the dips. Here is just a sample of some recent picks:
- SHOP picked again June, 2024 and it is up 78%
- TSLA picked again May, 2023 and it is up 155%
- CRWD picked March, 2023 and it is up 193%
- NOW picked January, 2023 and it is up 190%
- TTD picked again Dec, 2022 and it is up 141%
- AMZN again Nov, 2022 and it is up 138%
Also, the Motley Fool just launched a special promotion: $100 off (see the link below).
Here is their release schedule of their upcoming stock picks:
- July 3, 2025 - New Stock Recommendation
- July 10, 2025 - List of 5 Best Stocks to Buy Now List
- July 17, 2025 - New Stock Recommendation
- July 24, 2025 - List of 5 Best Stocks to Buy Now
So, if you have a few hundred dollars to invest each month and plan on staying invested for at least 5 years, we haven't found any better source of stock picks.
New Pricing: Motley Fool has slashed it price $100 for its top stock picking service.
CLICK HERE to get it in real-time.
