

The income statement summarizes a company’s revenues and expenses. Here’s an income statement example in order to measure a company’s health and the potential of its stock.
What’s An Income Statement?
To understand why an income statement is important, think of an internet startup that’s run out of the basement of the founder’s parents. Its assets consist of a computer, a desk and fold-out couch—as well as a few pens, some Post-it notes and a coffee cup. Not a very impressive company, and based on its “balance sheet” you wouldn’t give it a second look.
But look again. The company has no real expenses other than pizza and beer, as well as the cost of renting internet server space every month. The site is beginning to generate cash. Each month the hits it gets on its website triple—so its growth prospects are phenomenal. And it has also started to sell its first ads, which could bring in millions.
Suddenly that balance sheet doesn’t matter so much. It’s the “income statement” that really matters. (In reality, a start-up like this won’t have a formal income statement, but you get the idea.) After all, you could be looking at the next Mark Zuckerberg, and this company could be the next Facebook. And that’s why an income statement is important. A balance sheet provides a snapshot, but the income sheet tells a story—and it might be telling you a story that no one else has discovered yet.

Revenue
We all understand the concept of revenue: it’s money that you earn. And when you look at the income statement from McDonald’s it couldn’t be clearer.
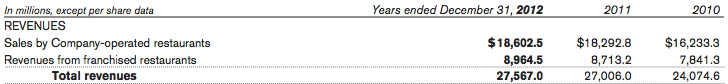
McDonald’s earns Revenue from selling food in its restaurants. On the income statement it divides this into two categories: Sales by Company-operated restaurants and Revenues from franchised restaurants.
In 2012, it earned $27.6 billion in Total revenues. (Don’t even think of how many hamburgers that is—it’ll make your stomach turn.)
Now that’s a huge number, but what does it really tell you? Well, on its own it doesn’t tell you much. You have to look at it from two perspectives:
- Did McDonald’s revenue grow compared to previous years?
- How did other fast-food companies do?
Big Mac is Getting Bigger
To answer the first question, look at the columns to the right of the year 2012. In 2011 McDonald’s total revenues were $27.0 billion, and in 2010 they were $24.0 billion. So that means revenue grew a lot between 2010 and 2011, and then slowed down in 2012.
The most important thing here is that McDonald’s revenues didn’t shrink. If revenues decline—especially over more than one or two years—it could indicate a problem. So over three years, the revenues numbers are not bad.
And now to the second question. We’ll take one really famous competitor and put them side by side with McDonald’s. Here’s a slice from the income statement of Burger King for 2012:
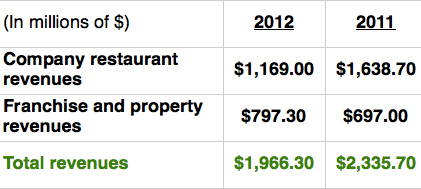

So Burger King earned just under $2.0 billion in revenues in 2012—a far cry from McDonald’s $27.0 billion. But more significantly, Burger King’s revenues declined between 2011 and 2012, by over $350 million. That’s a whopping fall for the Whopper. McDonald’s revenues are now looking even better.
Expenses
The company’s ability to earn revenues looks even more impressive when you consider what goes on in the minds of McDonald’s execs:
But revenues are only one part of the equation. You can earn all the money in the world, but if your expenses are out of control, you’ll still lose money.
Expenses—The Inescapable Cost of Running a Business
You’ve heard that old expression: you have to spend money to earn money. And it’s true. Whether it’s for advertising, buying the materials to make what you’re selling, paying your staff, or renting your offices, every business has expenses.
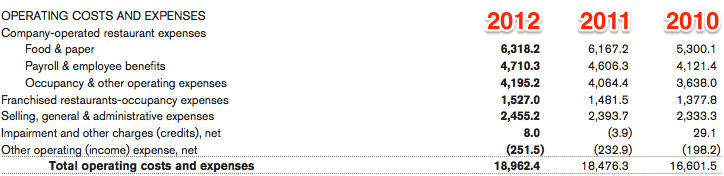
Now let’s look at the Expenses on McDonald’s Income Statement, which it calls Operating Costs and Expenses. They’re divided into things like:
- Food & paper (OK, the food bit we get, but the paper? Who knew McDonald’s spent that much on napkins and burger wrappers?)
- Payroll & employee benefits (that’s what they need to pay people to work those McJobs)
- and Occupancy expenses (McDonald’s doesn’t own the buildings where it has its restaurants, it rents the space).
Another big charge is Selling, general and administrative expenses. You’ll see this all the time on income statements and it basically covers everything from paying their advertising agency, to running their head office, to buying pens and office supplies—in other words, anything that doesn’t really involve making the burgers and fries.
For McDonald’s, operating expenses in 2012 were $19.0 billion. In 2011 they were $18.5 billion, and in 2010 they were $16.6 billion.
So How’s McDonald’s Doing on the Expenses?
Judging the performance of McDonald’s on expenses is not an easy task. To really know how well they’re doing, you’d probably have to run a restaurant company yourself. But even without that experience we can get some idea.
If you compare expenses over the three years shown, you’ll see that they are rising. But that’s no surprise. After all, their sales are rising too—and remember, you have to spend money to make money. Now if you do the math (you don’t have to—we did it for you), you’ll see that between 2010 and 2012 revenues rose by around 15%. And expenses rose by 14.5%—almost the same amount. Overall, McDonald’s expenses aren’t rising faster than revenues, which is a good sign.
Income
So we’ve covered the revenues McDonald’s gets from running its business, and we’ve covered the expenses too. We’re ready to see how much profit they made, right?
Not quite. There’s one more step before that, because there are other costs that a company has that don’t come directly from their operations. These can vary from company to company, but the big ones are the money needed to pay for borrowing and of course taxes.
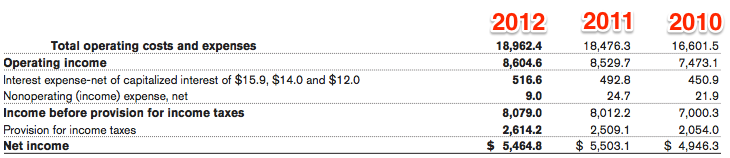
On the McDonald’s Income Statement these are shown as:
- Interest expense (that is, interest on loans to McDonald’s from the bank, or interest on corporate bonds that McDonald’s has issued) and
- Provision for income taxes (money they’ve put away for when the tax man comes).

It’s Happy Meal Time!
Once those items have been taken care of, McDonald’s is finally ready to enjoy its profits. These are shown in the Income Statement as Net income. In 2012 these amounted to $5.5 billion.
That’s a huge number—but McDonald’s is a huge company. You’d expect it to be making billions in profit every year.
To get a better sense of how it’s doing, you want to divide that profit by the number of shares outstanding. That tells you how much each share has earned, which is what shareholders really want to know.

Fortunately, you don’t have to dig up the number of shares and do that calculation yourself. McDonald’s has done it for you. It’s shown in Earnings per common share-basic, and it comes to $5.41. Now we’re getting to the heart of financial performance.
Company Performance
With earnings per share (often abbreviated to EPS), we’re on our way to understanding a company’s profitability. But what we really want to do is compare different companies so that we can find the best one to invest in.
There are two really good ratios we can use to do this: Net profit margin and Gross profit margin.
Net Profit Margin
Net profit margin is easy to calculate: it’s Net income divided by Revenues and is expressed as a percentage. So for McDonald’s in 2012, it’s $5.5 billion / $27.6 billion = 19.9%.
Here’s a visual of that calculation so you can do the same with another income statement no problem:
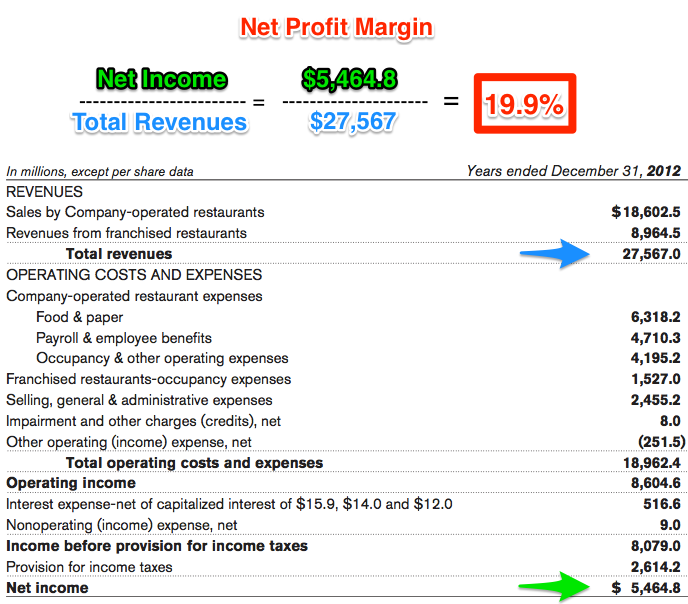
What that means is that McDonald’s made a profit of almost 20 cents on every dollar of food it sold.
The great thing about this figure is that it allows you to compare McDonald’s with other companies in the same industry. If competitors like Wendy’s and KFC are earning 24 or 26 cents on every dollar of sales, then McDonald’s doesn’t look so hot anymore.
On the other hand, if its rivals can only manage to make 15 or 16 cents on the dollar then McDonald’s is clearly leaving them in the dust. That’s the power of net profit margin: you can use it to stack companies up next to each other to see who really is giving you the most bang for your buck.
Gross Profit Margin
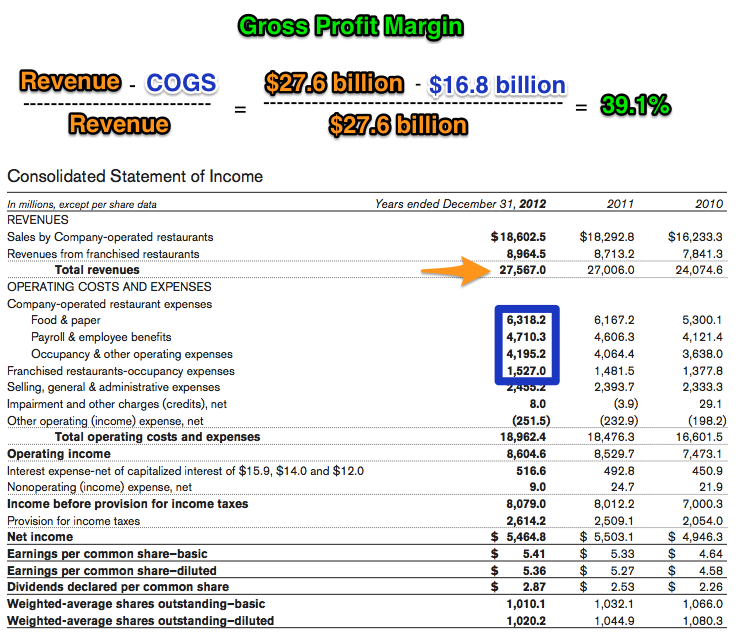
Gross profit margin (GPM) is not as easy to understand as net profit margin. It’s another ratio that is expressed as a percentage and it looks like this:


Your first question will be, what’s COGS? The answer is easy: it’s the Cost of Goods Sold, namely whatever a company paid to make the goods it sold. (In reality it’s a slippery number to calculate: it can include everything from raw materials to labor, storage, shipping, and overhead. It’s a heaven-sent opportunity for accountants to get creative.)
Knowing that, you can now calculate McDonald’s GPM in 2012. As we saw above, Revenue was $27.6 billion. And the cost of making the goods that brought in that revenue was $16.8 billion.
And your next question will be: what does Gross Profit Margin mean?
To understand that, let’s look at two scenarios.
- In the first one, let’s assume COGS is zero. (Of course this is impossible, but let’s just pretend for a minute we live in a fantasyland where a company can manufacture things at no cost.) GPM will be 100%, and that makes sense: the proportion of revenue left after paying to make the goods ($0) is…all of it!
- Now let’s look at the second scenario, in which COGS is equal to revenue. Obviously from the formula you can see that GPM will be zero. And that too makes sense: the proportion of revenue left after the company has made its goods is…none of it. (In other words, it’s not making any profit. In fact, after you include all its other expenses, it’s making a loss. And this scenario is perfectly possible, as you can imagine.)
Gross profit margin is also a good measure for comparing companies. It tells you how much money is left over to pay for everything else—from advertising, to head office expenses, to research and development—once the goods that are the lifeblood of the company have been produced.
A company with a high GPM is obviously in a better situation than one with a low (or even negative) GPM. McDonald’s has a GPM of 39.1%. This means that almost 40% of its revenue is left over for other things once it has taken care of the cost of producing its products. That’s a pretty healthy margin.
Using An Income Statement
So what happens to all that money McDonald’s makes?
Well, that brings us to the final number on the Income Statement, and that’s the Dividends declared per common share. McDonald’s paid a dividend of $2.87 on every share in 2012—that’s basically a cash payment straight to investors.

But if it earned $5.41 per share and it paid $2.87 per share to shareholders, that leaves $2.54 per share unaccounted for. Where did that money go?
The Hamburglar?


No, the Hamburglar died in 2003, because people thought he and all the other characters were too cheezy. The real answer is much less exciting: the money stayed with McDonald’s.
Remember back in our course on the Balance Sheet, when we talked about something called Retained Earnings? Well, this is where they come from: earnings that are not paid out as dividends are retained by the company. (Hopefully you’re getting a sense now of how the Financial Statements hang together.
McDonald’s uses the retained earnings to do one of two things: pay down debt or undertake activities that it thinks will make more profit. Of course it wants to keep shareholders happy with dividends, but it also wants to grow the company over the long term-and that really is what you want to look for when you’re investing.
Why Income Statements Matter
And that’s why the Income Statement is so significant. It gives you a picture of not only how the company is doing now, but also of how it may do in the future.
After all, a company that paid out all its profits in dividends might make shareholders very happy for a few years. But as a savvy investor, you would know that that’s not really a good thing, because it means the company may not be preparing for its future.
And this brings us to the really important point about income statements. You need to look at them over time.
Only when you look at income over three, four, or five years will you begin to get the company’s story. Is it keeping costs under control, year after year? Is its’ revenue growing, or has it stalled? If it’s in an industry that has matured (i.e., doesn’t have a lot of room for expansion) what are its plans for future growth?
The Income Statement answers a lot of those questions. And just as important, it makes you ask questions that you need to ask to fully understand where the company is going.